The Effects of Temperature, pH and Enzyme Concentration on Amylase
Written by Sarah
Introduction
Enzymes are proteins that are critical to catalyzing reactions (Brooker, Widmaier, Graham & Stiling, 2011). Like most proteins, they are synthesized by the ribosomes in the cell. They react with a specific substrate in order to increase the rate of a chemical reaction within the cell. Without enzymes, reactions would be significantly slower and we would not be able to do the most basic functions, such as breathing or digesting food.
Amylase is an type of enzyme. Amylase has an active site organized in subsites, each of which accommodates a glucose residue (Talamond, Noirot & de Kochko, 2005). It breaks down starch to glucose, giving food that sweet taste. An example of amylase in the natural world is in bananas. When they are green, the amylase has yet to break down the starch, but by the time they’ve turned brown, the reaction has been completed. This is why brown bananas taste sweeter than their green counterpart.
Within this experiment, the objective was to test how temperature, pH level and enzyme concentration changed the effectiveness of amylase.
Methods
First, an indicator experiment was performed. In two test tubes, a 1 mL (millimeter) sample of starch solution was pipetted. The same was done with 1 mL of maltose solution into another two tubes. Into one of the test tubes of maltose and one of starch, 5 drops of I2KI were added. In the other two test tubes of maltose and starch, 5 drops of Benedict’s reagent were added. The test tubes with Benedict’s reagent were placed in a hot sand bath. All four tubes were then watched for color change, indicating a reaction.
The activity of amylase was then observed through three reaction mixtures. The first mixture was 1 mL of starch solution and 1 µL (microliter) of amylase solution. The second was 1 mL of starch and 50 µL of water. The third and final was 50 µL of amylase and 1 mL of water. Immediately a drop of each mixture was transferred to a separate well on a spot plate and a drop of I2KI was added. This was then repeated every minute. The color was observed with the passage of time to conclude whether amylase activity was present or not. After 8 minutes, 5 drops of Benedict’s reagent was added to all three tests tubes which were then placed in the hot sand bath. The tubes were observed for color change, indicating the presence of maltose.
The effects of temperature were observed through three water baths set to 4°C (Celsius), 23°C and 37°C with a solution of pH 7 starch solution resting in all three. Fifty µL of amylase solution was pipetted into a test tube which was placed in the water bath for 1 minute. Then, 1 mL of the temperature equilibrated starch was added. Immediately a drop of the reaction was transferred to the spot plate and 1 drop of I2KI was added. This step was repeated every minute to test the presence of starch. Complete this process for all three temperatures. At the end, 5 drops of Benedict’s reagent was added and the tubes were placed in the hot sand bath.
Next, pH levels were tested. Four test tubes were filled with 1 mL of pH 4, 5, 6 and 7 starch solutions respectively. Then 50 µL of amylase were added to each tube and immediately, one drop of each mixture was transferred to the spot plate and a drop of I2KI was added. This was repeated at one minute intervals. After 8 minutes, add 5 drops of Benedict’s reagent was added to the test tubes and they were placed in the hot sand bath.
Finally, the effects of enzyme concentration were tested. One mL of pH 7 starch solution was pipetted into three test tubes. To one test tube, 50 µL of 5% enzyme was added, 50 µL of 10% enzyme to another and 50 µL of 20% enzyme to the final tube. One drop of each mixture was immediately transferred to the spot plate and a drop of I2KI was added. This was repeated every minute. After 8 minutes, 5 drops of Benedict’s reagent was added to the test tubes which were then placed within the hot sand bath.
Results
Within the indicators experiment, the first test tube changed from clear to dark purple. The second tube changed from blue to yellow. The third tube didn’t change and neither did the fourth.
For the activity of the amylase experiment, tube 1 indicated starch within the first test but didn’t after. Tube 2 indicated starch for all 8 minutes. Tube 3 never indicated starch. Only tube 1 changed any color after exposure to Benedict’s reagent and heat, proving maltose was present.
Temperature seemed to have a positive correlations with the speed of the reaction. The 37°C completed the reaction the quickest. This is shown in Figure 1. Maltose was shown to be present in all three test tubes.
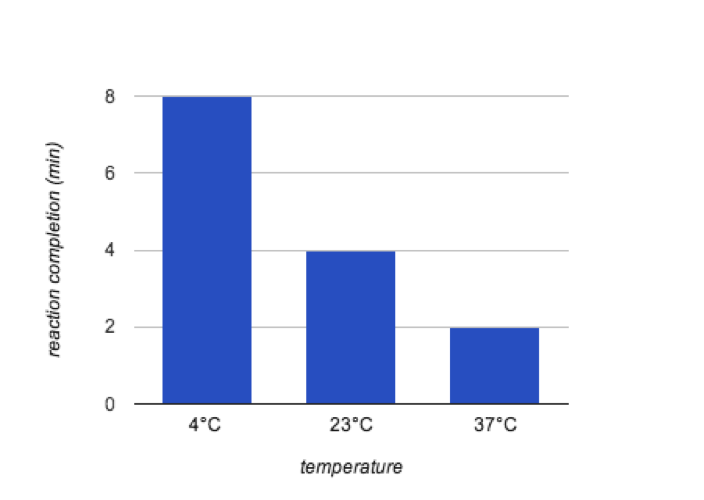
Figure 1. The Effects of Temperature on Enzyme Activity
The correlation of pH doesn’t seem as clear. Test tubes 2 and 3, which contained pH 5 and 6 starch, completed the reaction at the same time. Figure 2 shows the reaction rates of the different pH levels. Maltose was present in all test tubes.
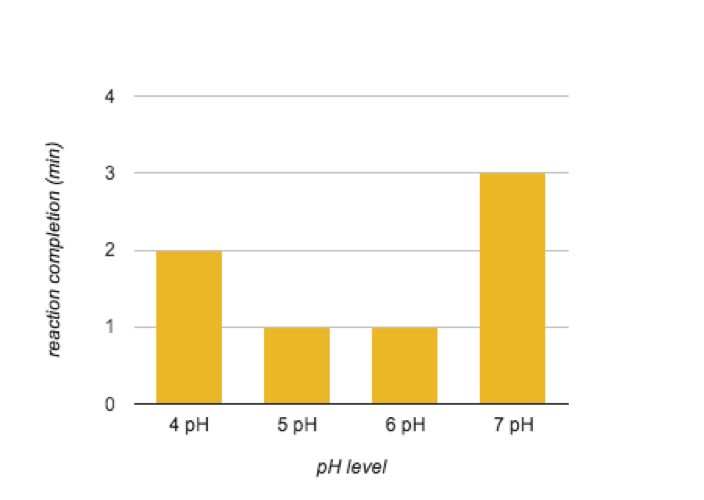
Figure 2. The Effects of pH Level on Enzyme Activity
As the concentration of amylase increased, the reaction time decreased. Figure 3 shows the direct correlation. All three tubes had maltose present.
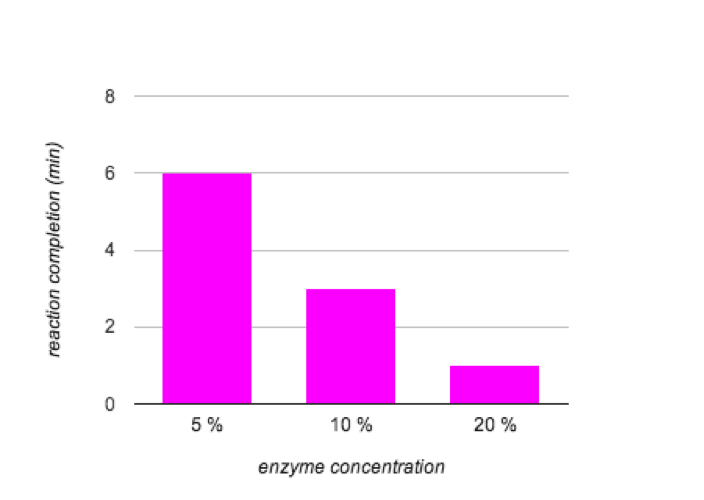
Figure 3. The Effects of Enzyme Concentration on Activity
Discussion
In the indicator experiment, it was necessary to test what each indicator marked. This allowed for I2KI to be used to indicate starch and Benedict’s reagent to be used to indicate maltose. The controls/amylase activity experiment showed that it is necessary for both starch and amylase to be mixed in order for the reaction to occur. As expected, as the temperature increased, so did the speed of the reaction. This is expected because this reaction often occurs in the human body where the temperature is normally 37°C. The results of the pH experiment did not clearly show what the best level for the enzyme was. The concentration experiment was much more clear. The 20% concentration reacted the fastest because there was more enzymes to react with the substrate and create maltose.
Literature Cited
Brooker, Robert J., Eric P. Widmaier, Linda E. Graham, and Peter D. Stiling. Biology. 2nd ed.
New York: McGraw Hill, 2011. Print.
Talamond, Pascale, Michel Noirot, and Alexandre De Kochko. “The Mechanism of Action of
α-amylase from Lactobacillus Fermentum on Maltooligosaccharides.”Journal of
Chromatography B (2005): 42-47. Science Direct. Web.
