Quantitative Assay for Fluorescein
Quantitative Assay for Fluorescein
By: David Gould
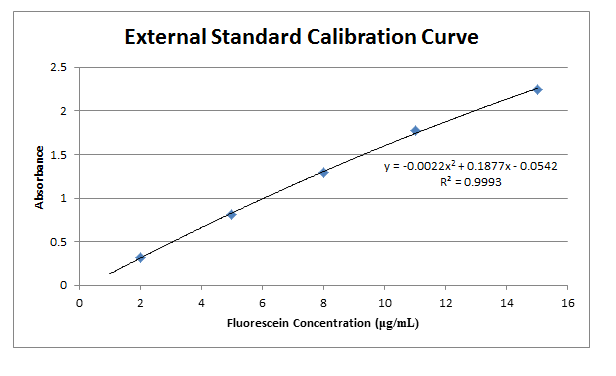
In this experiment several concentrations and variations of fluorescein were created and measured spectrophotometrically to determine absorbance at a peak wavelength. A calibration curve was made from the external standards to ensure the data showed a trend, as well as get a rough idea of any concentrations from future absorbance readings. Once standard additions were prepared and a graph made from this data, a reliable concentration was also obtained using the x-intercept. Given values of the calibration standard and unknown fluorescein were verified and matched up quite well, once the appropriate graphs were made.
Procedure:
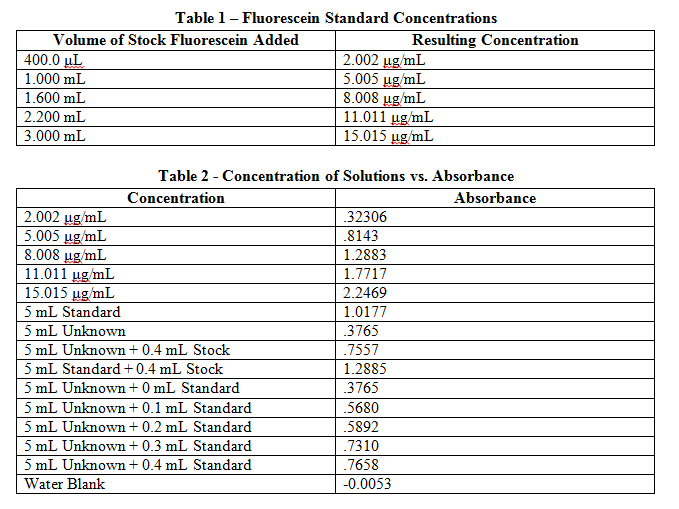
Five standards of fluorescein were prepared using a stock solution which had a concentration of 50.05 μg/mL. 1 mL of solution A – a citrate buffer of pH 5.4 – was added to each standard, and the solution diluted to volume of 10 mL with deionized water (exact concentrations of each standard listed in Table 1).
A calibration standard of 12.01 μg/mL fluorescein was placed in a plastic cuvette, and then placed in a spectrophotometer to determine the wavelength of maximum absorbance. This wavelength was then used in all following measurements to monitor all other solutions. Like the calibration standard, the other 5 standards were placed in plastic cuvettes and measured for absorbance at the wavelength found previously. These values are recorded in Table 2. A water blank was also analyzed to find a base error in absorbance values, and this blank value was then subtracted from each initial measurement.
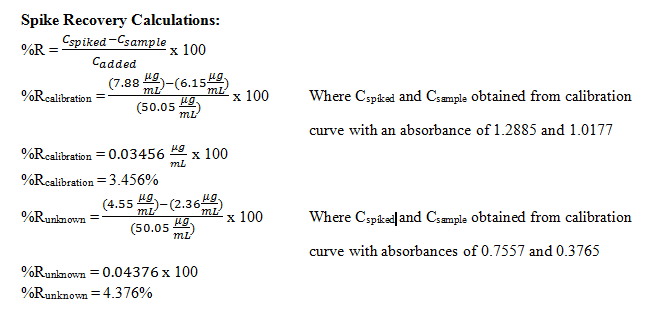
To validate the results obtained, a spike recovery was employed. 4 new solutions were created, the first made by placing 5 mL of calibration standard into a flask and diluting to 10 mL. The second by placing 5 mL of an “unknown” sample (4.00 μg/mL, in borate buffer at pH 9.7) in a flask and diluting to 10 mL. The third and fourth were made similarly to the first two, but before diluting 0.4 mL of the stock solution was added. Each of these spike recovery solutions were placed in a plastic cuvette, and evaluated as before.
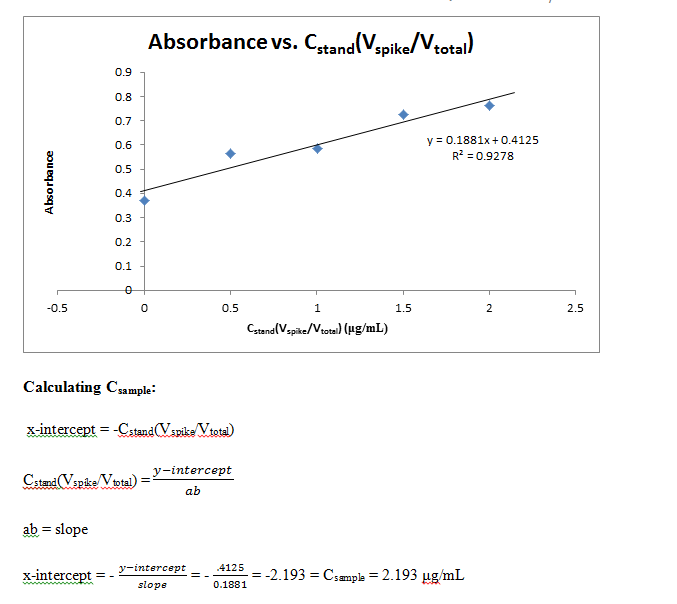
A final 5 solutions of standard additions were made by placing 0, 0.1, 0.2, 0.3, and 0.4 mL of the fluorescein standard into each of 5 10 mL flasks. 5.00 mL of the unknown sample were then placed in each, and finally diluted to volume with water. In the same manner as previous measurements, these 5 solutions were measured for absorbance and recorded.
Results:
Peak wavelength of fluorescein standard: 490 nm
Comments: Results from this lab seem to agree well with the actual values that should be obtained. The external calibration graph corresponds well with the line created, as soon by the R2 value as well. Other values too, once known, agree with this graph as well. The standard and unknown from the spike recovery also match this graph, as doubling those absorbances is equivalent to putting them at their undiluted concentrations – and just from looking at the graph one can see how these match up well. Slight fluctuations are due to Solution A not being found in the later solutions, which buffers the pH to a more acidic value, which changes fluorescein’s protonation and therefore its absorbance. It is also apparent from finding the concentration of the standard from standard additions that the x-intercept works out to be very close to have the value of the unknown. This makes sense, because it is being diluted to half its volume in these solutions, so again this data matches up well with what it should be.
References:
Cissell, K. Chem 314 Lab Manual, University Center, MI, 2014
ScienceLab.com/msds. Accessed January 26, 2014.
Appendix
Questions:
1. If a spectrophotometer was improperly zeroed, other species in a sample would interfere with the analyte of interest. If these species were present in large volumes while the analyte is very dilute, the results would still show a large absorbance, leading one to believe the analyte is actually present in a large concentration.
2. Having a recovery very far from 100% can easily be explained by an incorrect wavelength being used to measure an analyte’s absorbance. This could sway the observed absorbance of either the spiked or sample concentration to be much larger than the other, potentially giving major deviations. If the concentration of the added sample is small, deviations in the numerator can even more easily lead to a recovery much greater than 100%.
3. Even though one may see a percent recovery very near 100%, this does not always ensure an accurate analysis. Matrix effects can have an impact on the concentrations of the spiked and sample analytes, which can have varying degrees of change. Just by chance, some matrix effects could cause the difference between the spiked and sample concentrations to equal the actual concentration of the analyte in the denominator. This same difference would be soon in a true 100% recovery, and so the overall result would be the same and one would be unable to tell the difference just looking at the result of the percent recovery test.
