Reduction of Methylene Blue
Written by Allison Guindon
The rate constant of the reduction of methylene blue was determined by spectroscopy. The experimental koverall was determined to be 9.4±4.2L2/mol2/s at 295.15K. The experimental value was compared to the known value of 5.0L2/mol2/s resulting in a percent error of 88%. Sources of error include, not mixing the solutions and placing them into the spectrometer fast enough, or fingerprints on the cuvette.
BACKGROUND: Reaction rate constants (k) measure the speed of chemical reactions. Reaction rates depend on temperature, concentration of substances, the presence or absence of a catalyst, and the physical state of reactants. The Arrhenius equation expresses the relationship between rate constants and the activation energy, or the amount of energy it takes for a reaction to occur. The calculation of rate constants is used in the computer simulation processes in microelectronics and plasma chemistry. In the present experiment the overall rate constant of the reduction of Methylene blue was determined by spectroscopy.[1]
PROCEDURE: Hirko, R. Chemistry 114L General Chemistry I Laboratory, 5th ed.; bluedoor: Eden Prarie, MN, 2011; Experiment 30.
RESULTS: Table 1 shows the volumes of the solutions used in the mixtures and the kobs and concentration of the ascorbic acid. Figure 1 displays the trial 2 decay curve of Methylene blue. Figure 2 shows the maximum absorbance spectrum. Figure 3 shows the plot of ln(abs) vs. time. Figure 4 shows the plot of kobs vs. [AA]. The calculation is a sample calculation of how the uncertainty was calculated.
Table 1. Experimental data of kobs and asorbic acid concentration at 665.90nm
| Trial | Volume MB/ml | Volume H2SO4/ml | Volume K2SO4/ml | Volume AA/ml | Total Volume | Kobs/s | [AA] mol/L |
| 1 | 2.00 | 2.00 | 6.00 | 0.00 | 10.00 | – | 0 |
| 2 | 2.00 | 2.00 | 5.00 | 1.00 | 10.00 | 0.03036 | 0.00250 |
| 3 | 2.00 | 2.00 | 4.00 | 2.00 | 10.00 | 0.03042 | 0.00500 |
| 4 | 2.00 | 2.00 | 3.00 | 3.00 | 10.00 | 0.07802 | 0.00750 |
| 5 | 2.00 | 2.00. | 2.00 | 4.00 | 10.00 | 0.08673 | 0.01000 |
| 6 | 2.00 | 2.00 | 1.00 | 5.00 | 10.00 | 0.11920 | 0.01250 |
T= 295.15K
[MB]=0.0000700M [H+]= 3.00M [K2SO4]=0.025M
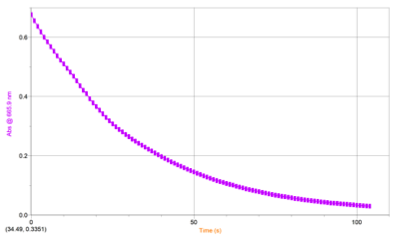
Figure 2. Decay Curve of Methylene Blue
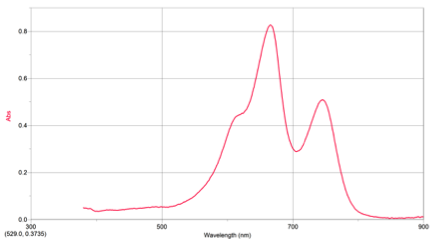
Figure 1. Maximum Absorbance Spectrum
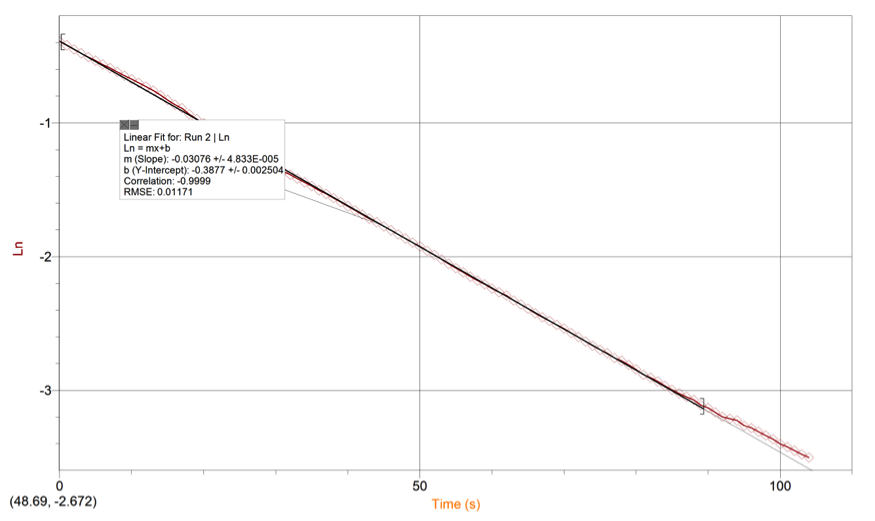
Figure 4. Ln(abs) vs Time Linear Regression
![k_vs_[AA]_linear_regression](https://www.odinity.com/wp-content/uploads/2014/02/k_vs_AA_linear_regression.png)
Figure 3. k (obs) vs. [AA] Linear Regression
Calculation: Uncertainty= 0.1500 * 2.78 = 4.2
DISCUSSION: The points on the plot of kobs vs. [AA] vary slightly from the linear regression. They are not significantly varied but they are not as close as the sample graph shown in the literature. The variation affects the koverall because the distance of the points on either side of the linear regression cause a more neutral slope. The experimental value of the koverall was determined to be 9.4±4.2L2/mol2/s, compared to the known value of 5.0L2/mol2/s it resulted in a 88% error. Variance could be attributed to being too slow to mix and place the solution in the spectrometer, not correctly diluting, or finger prints on the cuvette. Temperature effects rate constants directly. As temperature increases the rate constant does as well. In this experiment, however, increasing temperature resulted in a decrease in the rate constant. The previously stated sources of error could have contributed to the difference.
