Absorption Spectrum of a Conjugated Dye
Absorption Spectrum of a Conjugated Dye
By: Scott Holdren
Abstract
The absorption spectrum of a series of conjugated dyes is produced by a UV/VIS spectrometer to calculate the empirical parameter α and to find the length of the conjugated chain using the free electron model. Diluted solutions of each dye are analyzed using a UV/VIS spectrometer to determine the wavelength of maximum absorbance (λmax) for each dye. Using this wavelength, the best fit α is determined to be equal to 1 and the length of the box of 1,1’-diethyl-2,2’-cyanine iodide is 10.5 Å and increases with p (the number of carbon atoms).
- Introduction
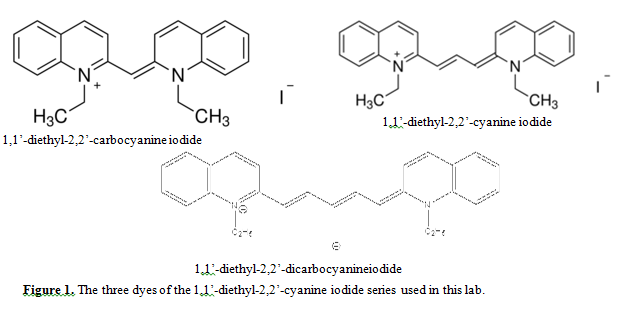
The purpose of this experiment is to determine the value of the empirical parameter α and determine the length of a conjugated carbon chain for a set series of dyes by a UV/VIS spectrometer. The conjugated dyes used in this experiment are shown below in Figure 1. The absorption spectrum of each dye is obtained from the instrument and used to find the maximum absorbance found at a certain wavelength (λmax). Once the λmax is determined, the value of α and the length of the carbon chain (box) can be determined using the free electron model. The length of the carbon chain in between the two rings of the three dyes is the ‘box’ that is measured.
 2. Experimental
The experimental procedure that was followed can be found in Garfield et al.1 The conjugated dyes shown above were used instead of the dyes mentioned in the procedure. In addition, the absorption spectrum for 1,1’-diethyl-2,2’-dicarbocyanine iodide was taken from Eric’s data.
3. Results and discussion
The spectrum of each dye was overlaid on the same plot shown in Figure 2. All of the conjugated dyes used have the largest absorbance at different wavelengths of light. Using the spectra shown, the λmax is determined by observing for each dye where the absorbance was the highest.
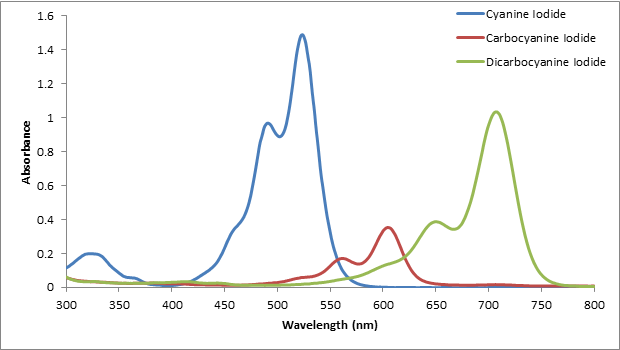
Figure 2. The absorption spectra of each conjugated dye. All three dyes have a different λmax.
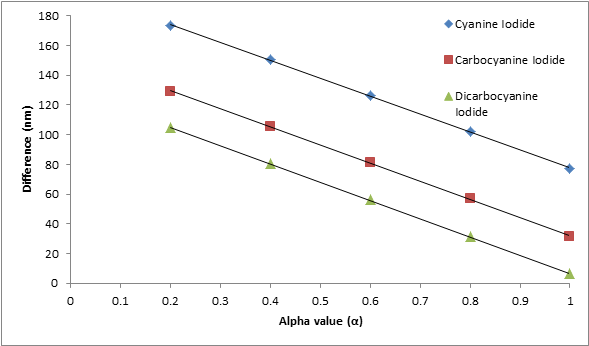
The empirical parameter α was determined as a best fit of the three die series. It is known that the value of α lies between 0 and 1. To show how α was found, Table 1 shows values of alpha that were used to calculate different wavelengths to see which calculated wavelength of 1,1’-diethyl-2,2’-cyanine iodide best fit the experimental wavelength obtained from the absorption spectrum. It is evident that the predicted absorption wavelength was closest to the experimental wavelength when α is equal to one. This calculation was repeated for the other two dyes. In Figure 3, the plot shows all three dyes have the smallest difference or best fit (λexperimental – λpredicted) when α = 1.
Table 1. The λmax value from the absorption spectrum and the predicted λmax from the free electron model of 1,1’-diethyl-2,2’-cyanine iodide.
|
Dyes |
Experimental λmax (nm) | Predicted λmax (nm) | Difference (nm) | α |
|
523 |
350 |
173 |
0.2 |
|
|
523 |
373 |
150 |
0.4 |
|
| Cyanine Iodide |
523 |
396 |
127 |
0.6 |
|
523 |
421 |
102 |
0.8 |
|
|
523 |
446 |
77 |
1 |
With this best fit value of α = 1, the absorption wavelengths of the conjugated dyes are recalculated using equation 61 and all additional parameters are shown in Table 2.
|
Table 2. The predicted λmax values calculated using α = 1 along with all other additional parameters. |
In the free electron model, α represents a constant for a series of dyes of a given type.1 In this lab, α represents the penetration distance which lies between 0-1. Therefore, if α = 1, this signifies that light or any electromagnetic radiation can penetrate a significant distance into the conjugated dyes.
The predicted absorption wavelengths and literature absorption wavelengths for each of the conjugated dyes are shown in Table 2 as well. The data shows that the free electron model is not very accurate but can be used for approximations. Another thing to notice about the accuracy is that as the carbon chain becomes longer (p increases), the predicted absorption wavelength using the free electron model becomes closer to the literature value.
Finally, the length of the box for each dye molecule from the absorption spectra was calculated by treating the system as a 1-D particle in a box. The energy associated with the electronic transitions in the conjugated dye can be calculated by using ΔE = hν. Since the λmax for each particle in a box is known, the frequency can be calculated which is then used to calculate the energy. For 1,1’-diethyl-2,2’-cyanine iodide, the energy transition is calculated in the following way:
ν = c/ λmax = (3.0E8 m/s) / (5.23E-7 m) = 5.74E14 s-1
ΔE = (6.626E-34 Js) (5.74E14 s-1) = 3.80 E-19 J.
This energy is then used to solve for the length of the box using equation 21where N is equal to the number of pi electrons in the carbon chain that is being measured.
ΔE = 3.80E-19 J = [(6.626E-34 Js)2 / 8(9.109E-31 kg) L2] (6 +1)
L = 1.05E-9 m = 10.5 Å
The calculated lengths of each box for each dye can be found in Table 4.
| Dye Name | Calculated lengths of box ( Å ) |
| 1,1′-diethyl-2,2′-cyanine iodide |
10.5 |
| 1,1′-diethyl-2,2′-carbocyanine iodide |
12.8 |
| 1,1′-diethyl-2,2′-dicarbocyanine iodide |
15.4 |
|
Table 3. The calculated lengths of the box using the free electron model. |
Summary
The experiment showed that finding the wavelength of maximum absorbance of a conjugated dye can be used to find the empirical parameter α and the length of a conjugated system within the dye. The predicted absorption wavelengths using the best-fit value of α appeared to fit better as the length of the box increased. In addition, the lengths of the box are calculated and increase with p (the number of carbon atoms).
- References
- Garland, C.W.; Nibler, J.W.; Shoemaker, D.P. Experiments in Physical Chemistry; McGraw-Hill: New York, 2009; 393-398.
