Analysis of Florida Well Water
Analysis of Florida Well-Water
By: Timothy Pemberton
Introduction:
For this project, the purpose was to experimentally determine the qualities of a sample of well water including ‘hardness’, amount of minerals, and they types of minerals present. The results obtained will then be compared to other lab groups who also conducted the same experiments on the same sample of water to reveal more conclusive evidence of the contaminants and quality of the water. Several methods will be used to test the purity and qualities of the water with the final goal being to determine if it is safe for human consumption. These methods include spectrophotometry, flame testing, conductivity testing, a calcium indication test, and a titration with Ethylenediaminetetraacetic acid (commonly known as EDTA) to determine the water’s ‘hardness’ or amount of minerals present (namely calcium and magnesium). The hypothesis for this experiment is that the water that will be tested is pure (or safe for human consumption) and is reasonably soft.
The flame test can indicate the minerals in the water, but only if they are part of a special set of minerals that burn different colors. These minerals include calcium, iron, and potassium—all minerals that have a high probability of being in the sample water.
The spectrophotometry test will help determine the types of contaminants found in the sample. The working theory behind conducting this test is that the contaminants in the sample will have differing wavelengths that correspond to contaminants. This is used by many laboratories. One of the largest uses for this type of identification is used for defining all the elements present in a gas; when a light is shined through it, the gas absorbs some of the wavelengths of light. This makes it possible to identify the components of the gas. The same idea will be used with our sample. Since pure water will not absorb any light, the contaminants alone will absorb light, making it possible to identify the particles in the water. Each different element has its own particular wavelength that it absorbs. As such, it will be possible to prove what contaminants are in the water.
Conductivity testing will help indicate the concentration of minerals that aid in the conduction of electricity through the sample. This will not determine the type of contaminants present, but rather a good approximation of the sample. All minerals, if dissolved into water, will raise the conductivity of the water. This means less resistance to the conduction of an electric current.
The calcium indication test will use calcium bentonite in conjunction with the conductivity test to definitively see if calcium is one of the contaminants present in the sample of water. The nH2O in the clay compound breaks free so that the clay compound is negatively charged. Because it is negatively charged, it acts almost as if it was a magnet—attracting all the positively charged ions around it, which includes calcium carbonate and potassium, among others.
Finally, the EDTA test will show the “hardness” of the water. This hardness is a measure of the calcium carbonate (CaCo3) and magnesium content.1 This water hardness does not affect the purity of the water, but it is a quality that can be important to consumers. As long as the water is not extremely hard, it will be safe to consume. The purpose of running this experiment is to prove that the water is above a certain standard as softer water is generally regarded as purer.
Procedure:
The procedure will be done as follows:
Gather materials for the experiment, and place approximately 250 mL deionized water into a flask. This water will serve as a waste container for used or contaminated samples. This container will be placed at the center of the table and can be emptied and refilled as often as needed.
pH Test. Take a piece of litmus paper and dip into the sample to determine the pH of the water. If the paper turns ‘cool’ colors (green/blue) then the sample is basic; if it turns a ‘hot’ color’ (yellow/red) it is acidic.
Separate the solid materials from the water in the sample. Take 30.0 mL of the sample and place into a 50 mL beaker. Place on top of a heating plate and place on the plate on the highest setting until all liquid has boiled out. Use the clamp to remove the beaker from the heating plate to prevent burning. Take the spatula and scrape all of the minerals out into another 50 mL beaker after cooling. These are the minerals present in the water.
Flame Test. Acquire the Bunsen burner and light it. Take the minerals made in Step 2 and place onto a wire loop. If the resulting minerals do not cohere to the loop, dip loop into a test tube with the sample water in it then into the powder and proceed. Hold the tip of the loop over the tip of the flame and observe the changes in color made by the substance. Different colors indicate differing materials. Repeat as many times as needed to
Spectrophotometry Test. Take the pure sample and place into a 50 mL beaker; transfer enough liquid to fill a cuvette up to the fill marker. Be sure to calibrate the spectrophotometer properly. Place the sample into the spectrophotometer and observe the peaks in absorbance for light between about 390 and 700 nm (the visible spectrum). Each material has a different wavelength, so this test will indicate what minerals are in the water, but not how much of them. If the readings are not pronounced enough to draw accurate conclusions, take the sample made in Step 2 and add a measured amount to 10.0 mL of the pure sample to increase the amount of contaminants in the water. Do this only after completing the flame test. This should deliver more robust results. Repeat two more times, making sure to wash the cuvette between each test.
Conductivity Test. Calibrate the conductivity meter. Use 30 mL of deionized water in a 50 mL beaker as a control and measure the conductivity of the water in Ohms. Be sure to not let the probe touch the bottom of the beaker, while still remaining fully submerged. Take 30 mL of the sample in another 50 mL beaker and properly place the conductivity probe into the sample and record the resistance of the sample in Ohms (Note: the resistance in Ohms should be larger for the deionized water than for the sample). Compare to a chart to see whether the sample water has few enough minerals for safe consumption. Repeat two more times, making sure to wash the containers thoroughly before each reading.
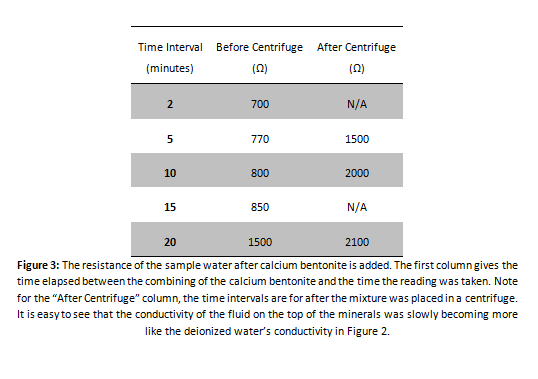
Calcium Indication Test. The purpose of this test is to experimentally prove if calcium is in the sample. Calcium bentonite is used to do this. Take 10.0 g of this substance and pour into 20.0 mL of the sample. Allow to sit for at least 30 minutes to allow the mixture to settle. If, after half an hour, the mixture is not completely settled, allow to remain at rest for 30 minutes more. After the mixture is settled, use the conductivity meter to measure the conductivity of the liquid at the top of the beaker. If the resistance is the same as deionized water, the calcium bentonite reacted with the calcium in the water and settled.
EDTA Titration. Gather 7.306 g of EDTA and pour into a 500 mL beaker with 250.0 mL of deionized water. This will create a 0.1 M mixture of the EDTA. Heat for approximately 5 minutes or until the mixture is fully dissolved into the water so that it is fully transparent. Be careful not to let the water boil out as this can affect the molarity of the final solution. After, place into an ice bath to quickly cool the mixture. During the heating and the cooling process, mix 10.0 mL of the sample water with 40 mL of deionized water in a 250 mL Erlenmeyer flask. Add eight drops of the Eriochrome Black T indicator and 6 drops of the weakly basic ammonium (NH4+). The result should be a pink-red color.2 Once the EDTA mixture has cooled, pour into the burette. Be sure to mark where the burette is filled up to; although it is possible to be filled up to anyplace to get good results, it must be in the marked area. The final volume left in the burette will be subtracted from the initial volume. Place the Erlenmeyer flask holding the sample and indicator under the burette containing the 0.1 M EDTA. Allow the EDTA to slowly drip into the sample until the indicator turns the mixture to a blue shade. Find the volume of 0.1 M EDTA that was allowed to drip; this number will be used in the final calculations. Repeat five more times.
After the experiment is complete, wash all equipment thoroughly with soap and clean work space.
Results:
pH Test
When the litmus paper was dipped in the sample water, the litmus turned a slightly green tint. This indicates the sample water is about neutral.
Boil Test
When the sample was boiled so that no water remained, the resulting precipitate left at the bottom of the beaker was grainy and white. It dissolved easily in water. It was adhering to the bottom of the beaker firmly, but could be somewhat easily scraped off.
Flame Test
The white minerals made in the boil test burned an orange or red-yellow color when placed in a Bunsen burner’s flame on a wire loop. A purple flame may have appeared, but only for an instant.
Spectrophotometry
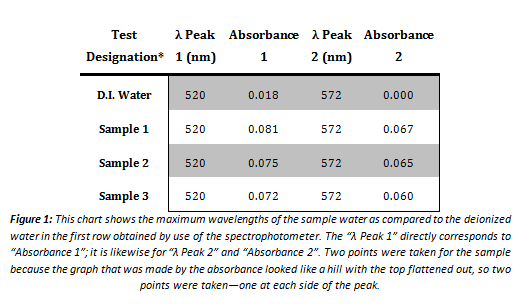
*This is not from the first set of tests conducted. The first time the sample water was tested using the spectrophotometer, the results were inconclusive. The data obtained was too nominal to include as decisive data. The maximum wavelength was essentially zero for each point on the graph, and constantly fluctuating from the negative part of the graph to the positive. This data taken was thus thrown out as unusable.
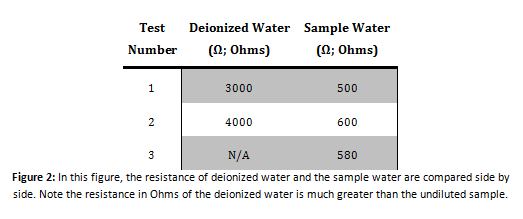
Conductivity Test
Calcium Indication Test
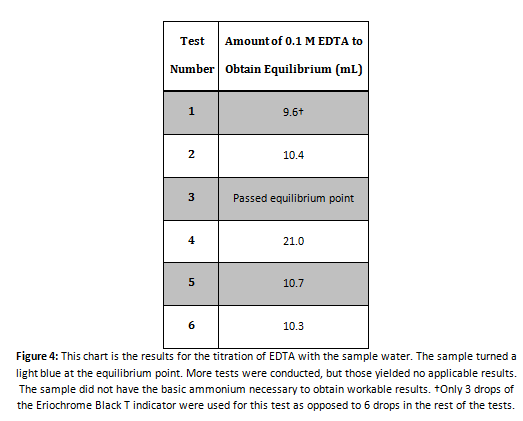
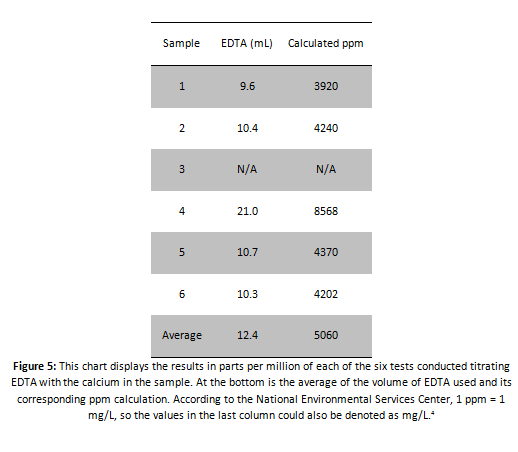
EDTA Titration
Sample Math for Calculating the Parts Per Million of Calcium
Using the results from Sample 1 in Figure 4:

Using this method, parts per million can be calculated for all the tests conducted:
Discussion:
Our results were overall conclusive, save for the flame test. Though it was clear that the flame burned a vivid red-orange color, it was brought up that there were possibly purple flashes visible in the flame. These bursts were either very brief for the entire group to see or nonexistent. It is clear through the flame test however (and the titration with EDTA) that calcium was present. After the water had boiled out and just the contaminants remained, the white powder that remained was uniform in look and texture. When the remaining minerals were dissolved in the sample water to enhance the quality of the spectrophotometry results, the minerals dissolved extremely easily; no stirring or agitation was necessary for them to completely dissolve into the sample water. The conductivity test was quite straightforward and went as expected. The sample had a much higher conductivity than the deionized water. At first, there were issues with the results from the spectrophotometry. At most points along the graph, the plot was jumping above and below the zero line—which gave questionable data concerning the maximum wavelength and its absorbance. The problem was averted by simply using the excess minerals from the flame test and adding to the sample for a higher dilution of the minerals in the sample. The amount of minerals did not matter for the spectrophotometer, as just what minerals were present mattered. As long as no outside contaminants were allowed into the sample, the sample remained the same for the purposes needed. The only thing that changed was the total concentration of the contaminants. The titrations in the first week went poorly. The basic ammonium buffer was not added to the sample, so the indicator did not work as expected. This problem was fixed in the second week of testing by adding the buffer, which yielded workable results. The conductivity test gave a result that the water was just below city water according to the following chart:
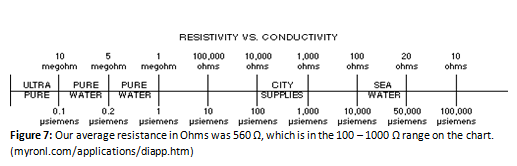
This supports the hypothesis that the water is pure enough to drink. There are not enough contaminants to label the water as impure.
Conclusion & Relation to Research:
In conclusion, the sample water in ‘Sample B’ of well water definitively had calcium carbonate in it, and possibly potassium. The results from the spectrophotometry indicate that potassium was present in the sample water along with calcium and magnesium. These elements all have wavelengths found in the 520-572 nm wavelengths that we obtained with the spectrophotometer. According to our calculations, the water was extremely hard. With values well over 4000 mg/L, the data obtained is questionable according to the water hardness chart given by the US Geological Service which states that 0-60 mg/L is soft, 61-120 is moderately hard, 121-180 is hard, and >181 mg/L is very hard. Our smallest value was approximately 3920 mg/L. This value is over 2100% above the highest value for hard water. This fact throws the values obtained for the titration into serious doubt. The results from the conductivity test contradict these results, and will be preferred over the titration. Simplicity is the reason this is so. The conductivity test was simple, while the EDTA titration needed large amounts of math where errors could easily arise unnoticed. The experiment itself was not a complete loss however, as long as no poisonous or relatively unnoticed contaminants that are highly fatal were present, according to the combination of all the tests the water was completely safe for human consumption. The hypothesis was half proved right. The water is safe to drink, but was not very soft at all.
This experiment is important to those in charge of maintaining and testing the water supplies of major water distributers across the nation. The company who releases unhealthy water to the people would be in serious threat of lawsuits or jail time. Without scientists present to periodically check the purity levels of the water supply, water companies could be unknowingly selling and distributing a serious health concern. Some of these same methods used in this experiment are almost exactly those ran by the scientists that are in charge of testing water for its purity and mineral content. All water processing facilities put their product through a strenuous purification process that leaves good minerals in the water while removing the harmful contaminants. The city of Tampa’s water supply is checked over 1000 times per month.6 According to the City of Cincinnati’s Water Works’ website, the water they produce is checked for quality over 600 times per day.5 If one is not on city water or any that comes from a water plant, those who use well water can send their water in to a laboratory to be tested for contaminants and to see if the water is safe for consumption. These labs also use many of the same methods to check the purity of the water. If the water fails the tests, a report is sent back that the water is unsafe for using. These processes are important to millions of people each and every day. If a bad batch of water gets out to the public, an epidemic affecting all these of people would certainly strike. Thus, it is important that water goes through the treatment process and testing to ensure that the people will be safe when drinking water.
References:
- City of Glendale Water and Power. Water Hardness. Glendalewaterandpower.com (Web) accessed Mar 18, 2013.
- ACS Publications. Complexes of Eriochrome Black T with Calcium and Magnesium. Pubs.acs.org (Web) accessed Mar 19, 2013.
- US Geological Service. Water Hardness and Alkalinity. Water.usgs.gov/ (Web) accessed Mar 19, 2013.
- National Environmental Service Center. “What does ppm or ppb mean?”. (Web PDF) nesc.wvu.edu accessed Mar 19, 2013.
- City of Cincinnati. Water Quality. cincinnati-oh.gov/water (Web) accessed Mar 19, 2013.
- City of Tampa. Water Quality. tampagov.net/dept_Water/ (Web) accessed Mar 19, 2013.
- Myron L Company. Deionized Water. myronl.com (Web) accessed Mar 19, 2013.
