Exploring Cellular Respiration by Measuring CO2 Production from Saccharomyces cerevisiae Aerobic Respiration
Written by Hayden
Introduction
Most eukaryotic organisms require glucose for the first step in their metabolism (Ozcan, et. al.), and Saccharomyces cerevisiae is no exception. This strain of yeast was used in this experiment to examine cellular respiration at different temperature levels and with carbon sources other than glucose. Yeast is used to study metabolism because there is a lot of information on this particular strain of yeast because it is widely used for baking, brewing, and other techniques for making food (Brink, et. al. 2008). Although glucose is commonly used in metabolism, other sugars can be metabolized. For example, the rate of glycerol metabolism by yeast has been measured but has shown to be slower than metabolism of other sugars (Gancedo, et. al.).
The effect of temperate is also important to take into consideration of metabolism because there are so many enzymes involved. Enzymes are very sensitive to temperature and this experiment can demonstarte that by measuring the amount of carbon dioxide produced from glucose metabolism at different temperatures.
Similarly, the type of sugar used can affect the rate of metabolism. This lab measures carbon dioxide produced from the metabolism of glucose, lactose, glycerol, and sucrose.
Hypothesis
I hypothesize that the most CO2 will be produced from the glucose carbon source because it enters glycolysis directly, then sucrose and lactose because they are disaccharides, and lastly glycerol, because it is an alcohol that is not a sugar. I hypothesize that that Saccharomyces cerevisiae will grow best and produce the most CO2 at 30 degrees Celsius, then 50 degrees, and lastly, 4 degrees Celsius.
The results from our experiment do not support my hypothesis that S. cerevisiae would grow best at 30 degrees Celsius but instead suggest that it releases the most CO2 at 50 degrees Celsius. It did not do well at 4 degrees, as hypothesized.
Experimental Procedure
For the temperature tests, three different water baths were set up and kept at 4 degrees Celsius, 30 degrees, and 50 degrees. Six test tubes were gathered and labeled; two each for the three different temperature variables and then if they were the control or the tube with added glucose. Two milliliters of yeast were added to each tube. Each tube was placed in its corresponding temperature water bath, as was the respiration chamber. The set up was staggered, though, because we were limited by one CO2 sensor. Two milliliters of glucose were added to the first test tube to measure CO2 production from glucose (not the control) and incubated for ten minutes. After the incubation period, one milliliter of the yeast mixture was added to the respiration chamber and the CO2 sensor was set up to record CO2 produced at a rate of six times per minute for four minutes. Once the four minutes were completed, the CO2 sensor was removed to allow it to reset. This was repeated for the remaining two test tubes measuring CO2 from metabolism of glucose. For the controls, the same procedure was completed substituting two milliliters of water for glucose.
For the carbon source tests, a 30 degrees Celsius water bath was set up. Five test tubes were labeled with the four different carbon sources with one control tube. Two milliliters of yeast were added to each one and two milliliters of the carbon source were added at the time of incubation. The same steps were completed as in the temperature tests above where each tube was incubated for ten minutes and then the CO2 levels were recorded.
Data
Table 1: Group 1 Temperature Test
| Substrate | 4 Degrees | 30 Degrees | 50 Degrees |
| Glucose |
127.3 |
255.4 |
951.8 |
| Water (Control) |
125.9 |
138.3 |
325.8 |
Table 2: Class Average Temperature Test
| 4 degrees | 30 Degrees | 50 Degrees | |
| Yeast + Glucose |
83.9 |
298.7 |
450.3 |
| Control (Yeast + Water) |
85.6 |
103.3 |
234.7 |
| St. Dev. (Yeast + Glucose) |
55.4 |
207.4 |
328.3 |
| St. Dev. (Yeast + Water) |
31.9 |
27.3 |
149.9 |
Table 3: Group 1 Carbon Source Test
| Group Carbon Source | Respiration (ppm/min) |
| Glucose |
135.8 |
| Sucrose |
102.5 |
| Lactose |
46.6 |
| Glycerol |
64.2 |
| Control 1 (40 min Incubation) |
84.4 |
| Control 2 (10 minute Incubation) |
35.1 |
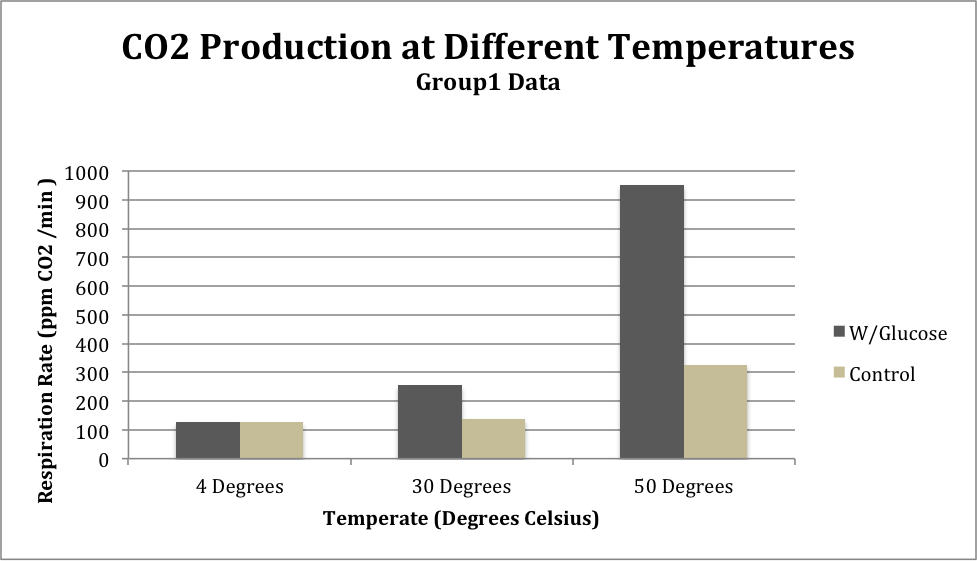
Figure 1: CO2 levels from Group 1 comparing between substrate (glucose or water) at different temperatures
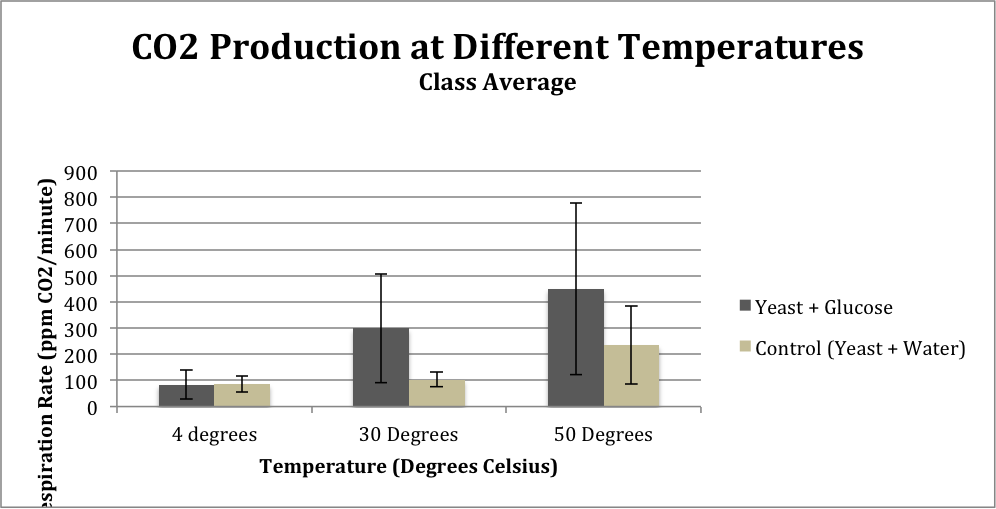
Figure 2: Class average CO2 levels from comparisons between substrate (glucose or water) at different temperatures
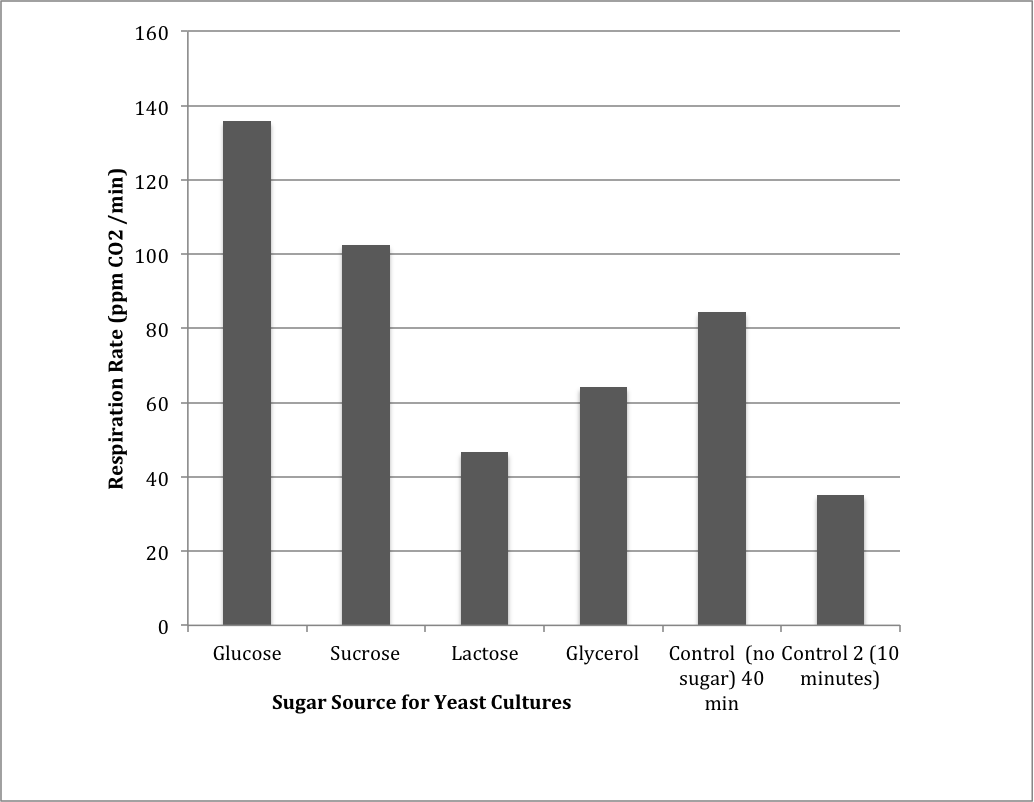
Figure 3: Measuring CO2 production from different carbon sources as compared to a control.
Results
The results from the temperature tests from both Group 1 and the class average show a similar trend: respiration rate is lowest at the temperature of 4 degrees Celsius and is highest at 50 degrees Celsius. The standard deviation of the class average at 4 degrees Celsius was 31.9, at 30 degrees was 27.35, and at 50 degrees was 149.89.
The results from the carbon source tests indicated that glucose was most readily metabolized to produce the most CO2, followed by sucrose, glycerol, and finally lactose. There were two controls, one that incubated for 40 minutes and one that incubated for 10 minutes. The control that incubated for 10 minutes did not produce as much CO2 as the control that incubated for 40 minutes.
Discussion
The hypothesis regarding temperature was not supported by the results, which indicated the most carbon dioxide was produced at 50 degrees Celsius in the results from both Group 1 and the class average. I did not expect to see this because I was thinking about using yeast for making products like bread or beer that are kept at about room temperature for a period of time.
The hypothesis regarding carbon sources was supported because the results show that the most carbon dioxide was produced when the carbon source was glucose. Carbon dioxide level was next highest with sucrose, then glycerol, and then lactose. Because organisms usually break down larger sugar molecules to glucose to enter cellular respiration, it makes sense that sucrose had the next highest levels of carbon dioxide produced. Sucrose is broken down to glucose and fructose. I was surprised, however, that more carbon dioxide was produced with the carbon source glycerol than lactose because it seems that glycerol would require more steps before being able to enter cellular respiration.
There are possible errors that would affect the results of this experiment, such as inaccuracies with the carbon dioxide sensor. It may not have been completely ‘reset’ after each reading or it may not have been completely attached to the respiration chamber and allowed atmospheric carbon dioxide to enter the chamber. Additionally, the timing of when the glucose was added and the time of incubation were crucial to accurate recording of carbon dioxide.
Works Cited
1. Joost van den Brink, André B. Canelas, Walter M. van Gulik, Jack T. Pronk, Joseph J. Heijnen, Johannes H. de Winde and Pascale Daran-Lapujade (2008), Dynamics of Glycolytic Regulation during Adaptation of Saccharomyces cerevisiae to Fermentative Metabolism, Applied and Environmental Microbiology, Accessed October 30, 2013 at http://aem.asm.org/content/74/18/5710.full
2. C. Gancedo, J. M. Gancedo, A. Sols (1968). Glycerol Metabolism in Yeasts, Centro de Investigaciones Biologicas, Madrid. Accessed October 29, 2013 at http://onlinelibrary.wiley.com/store/10.1111/j.1432-1033.1968.tb00353.x/asset/j.1432-1033.1968.tb00353.x.pdf;jsessionid=084020F359E483A3AC7F2040B11877DD.f01t01?v=1&t=hngk5i7d&s=fe2b48d19ee4e3b4c535727b1411121bcf5e8d3d
3. Sabire Ozcan, Jim Dover, Anne Rosenwald, Stefan Wolfl, Mark Johnston (1996). Two glucose trasnporteres in Saccharomyces cerevisiae are glucose sensors that generate a signalfor induction of gene expression, National Academy of Sciences. Accessed Octob 30, 2013 at http://www.ncbi.nlm.nih.gov/pmc/articles/PMC38008/pdf/pnas01526-0386.pdf
