Synthesis and Spectroscopy of Eu(III) and Tb(III) diketonate complexes
Written by Alex
Abstract
The purpose of this experiment is to determine the electron energy transitions on Europium and Terbium complexes with tmh. This was determined by finding the wavelengths of the peaks in an emission spectrum of those complexes. It was found that the largest peak of the Europium complex was at 614 nm, and the largest peak of the Terbium complex was at 547 nm.
Introduction
In order to understand photochemistry, one must understand the basics of atomic orbitals. First of all, one must know that electrons can be excited, or pushed up an energy level, and once that happens, the electrons generally fall back to their original energy levels, but when they do that, they emit a photon. Another thing to note is that in all lanthanides, the outermost electron shell is the S shell, which presents a problem for photochemists because, since the lanthanides are in the F block, the shell that is filled last is not the shell that is reactive, so without proper manipulation, all lanthanide emissions would look the same, and it would not be very interesting. Luckily, there is a way to reach the F shell, which is where all of the interesting photochemistry happens, and that is by attaching an “antenna” ligand that will channel energy underneath the outermost shells and into the F shell, where it can then excite the electrons and produce interesting photochemistry. In this experiment, europium and terbium were complexed with a diketonate antenna ligand in order to produce this effect.
Procedure
The first part of the experiment was the synthesis of the lanthanide complexes. For both, the ligand, 2,2,6,6-tetramethyl-3,5-heptanedione (tmh) was dissolved in ethanol with NaOH. Then, separately, 2,2’-bipyridine (bpy) was dissolved in ethanol, and it was added to the tmh solution. This was allowed to stir for 30 minutes, and then a solution of the respective lanthanide salt was added dropwise to the tmh-bpy solution. The complex then precipitated out of the solution, and it was collected by vacuum filtration. After the complexes were synthesized, each of them was separately dissolved in a very dilute methanol solution, and the UV-Vis spectrum was taken. Following that, a fluorimeter was used to take the emission and excitation spectra of the complexes.
Data and observations
Empty Eu vial: 12.98 g
Vial + Eu: 13.36 g
Empty Tb vial: 12.87 g
Vial + Tb: 13.26 g
λmax Eu: 286.8 nm
λmax Tb: 286.8 nm (Exactly the same as Eu)
Results
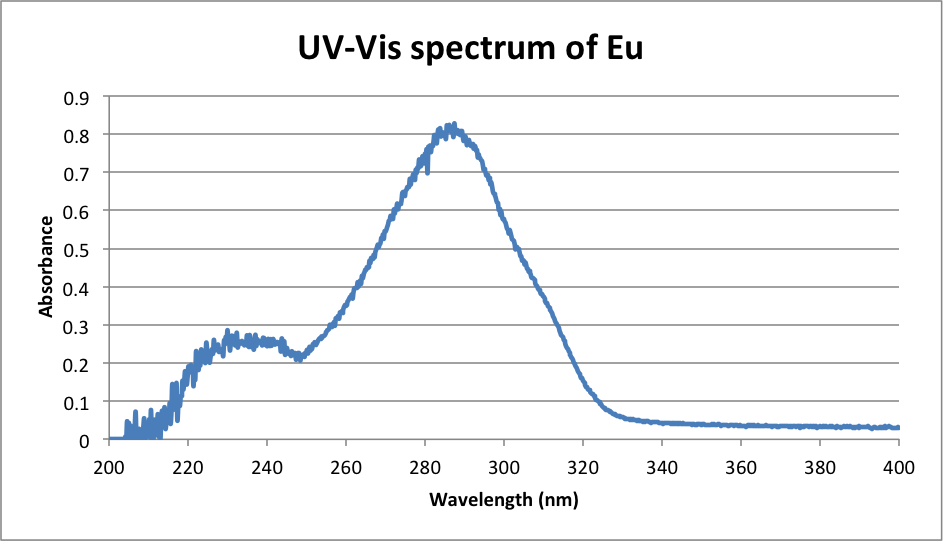
λmax = 286.8 nm
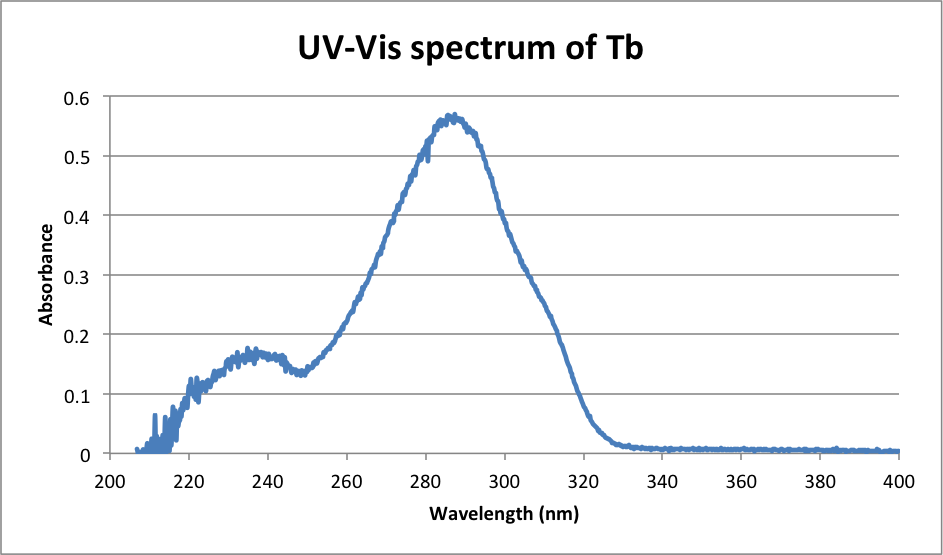
λmax = 286.8 nm
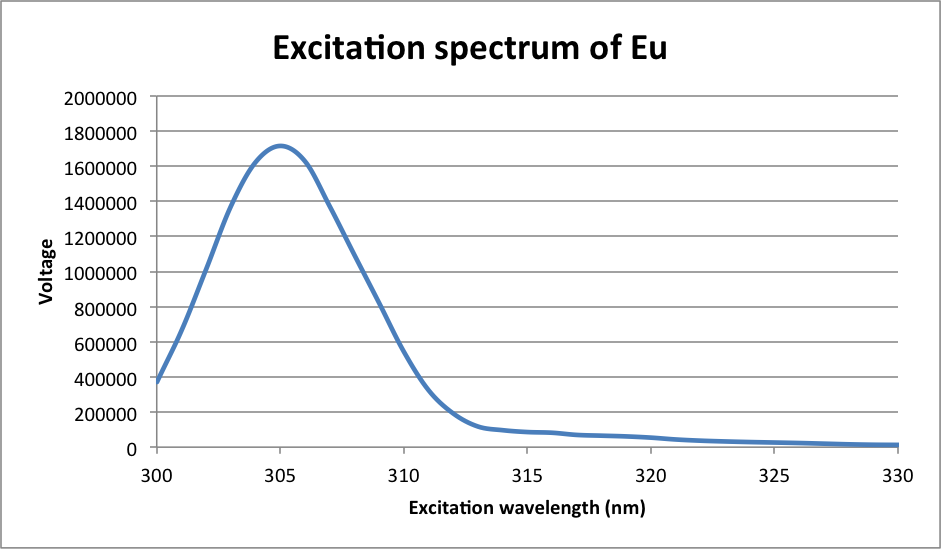
λmax = 305 nm
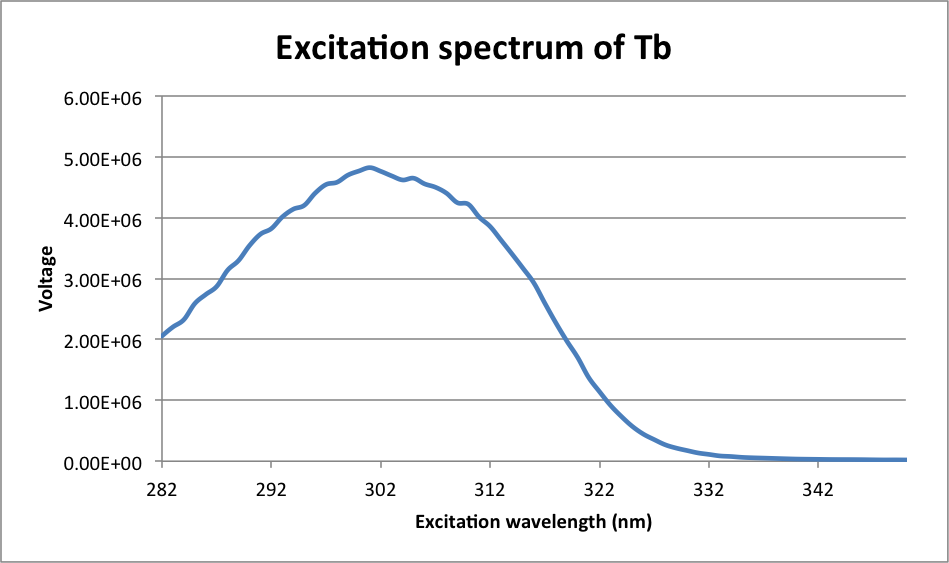
λmax = 301 nm
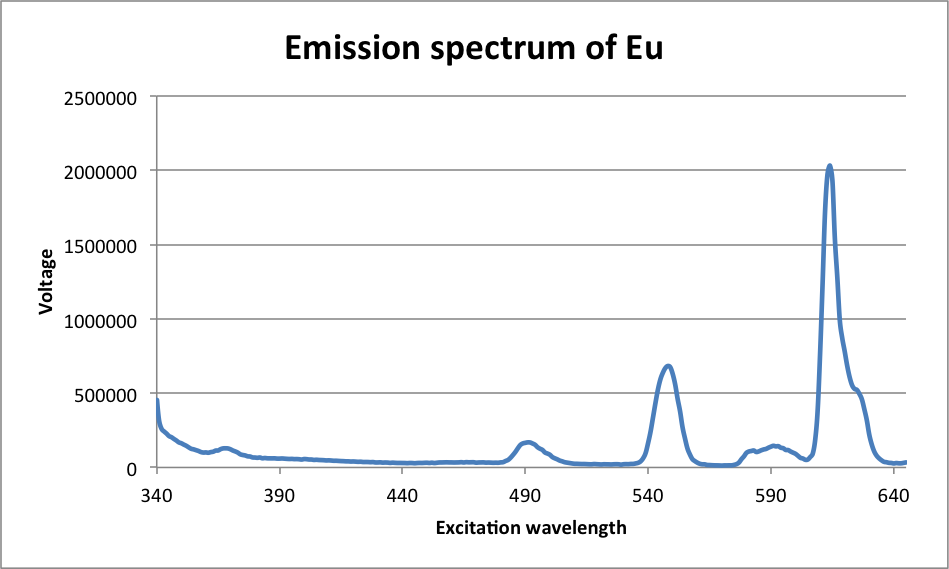
Largest peak at λ = 614 nm
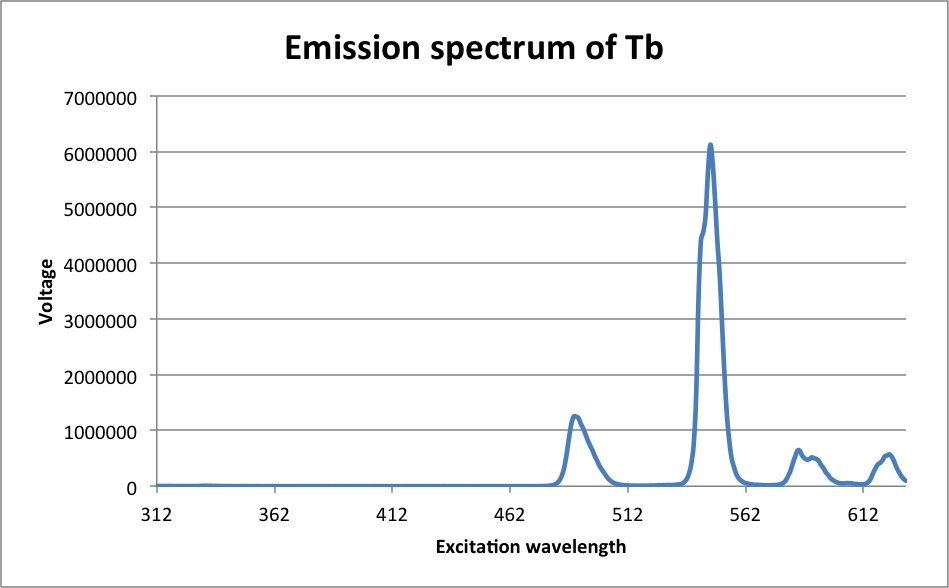
Largest peak at λ = 547 nm
Sample calculations
1e7 (nm/cm)/286.8 nm = 34867.5 cm-1
Discussion
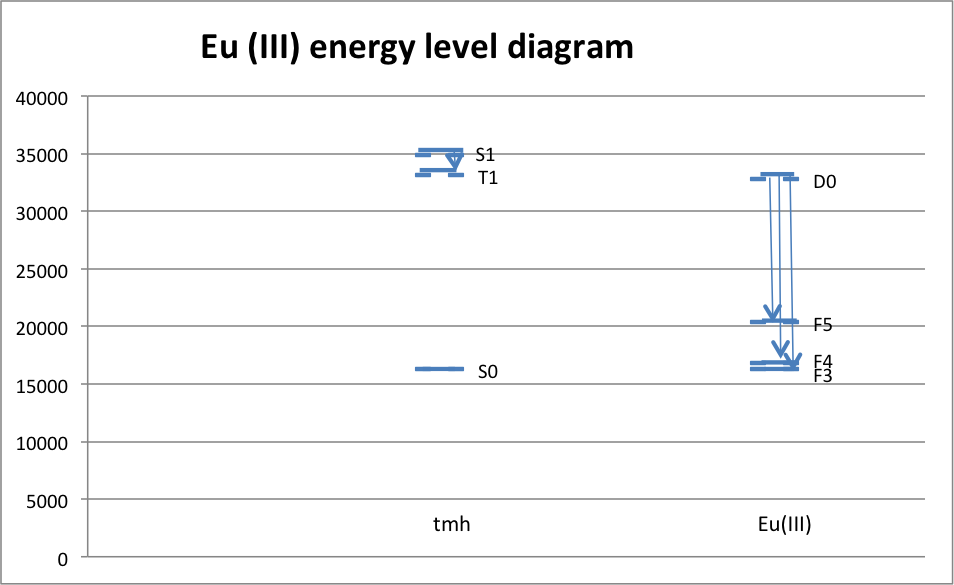
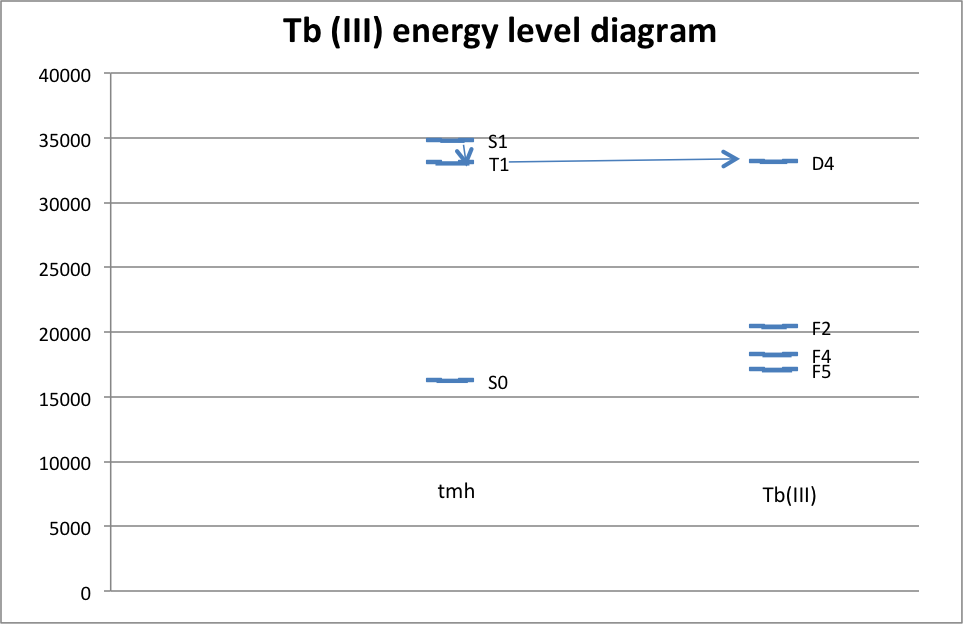
It can be inferred from the data that the most likely electron transitions are the ones with the largest peaks. There is a very large number of molecules reacting, so of course, the most likely transition will occur the most, and this is reflected in the color of the luminescence. If the most common electron transition occurs with a large enough frequency, then the detected wavelength should be very close to the wavelength of that transition. As it happened, the transition with the highest peak in the Europium complex was D0 à F3, which occurred at a wavelength of 614 nm. The transition with the highest peak in the Terbium complex was D4 à F5, which occurred at a wavelength of 547 nm. Both of these peaks are consistent with the observed color of the luminescence. On a different scale, it was observed that the complex precipitated in a polar solution. This is because the complex is non-polar, and non-polar and polar substances do not mix. Some possible sources of error in this experiment include first and foremost that the spatulas were shared among the class, and because of that, there was considerable cross-contamination between metals. This was corrected for by ignoring the peaks on either graph that were at the same wavelength as the highest peaks on the other graph. The problem that that poses, however, is that it is then very difficult to ascertain whether or not there was a smaller peak for the complex that was being texted at or near the same location. Another possible source of error includes imperfect calibration of the spectroscopes. Methanol has properties that can certainly be picked up by UV-Vis and slightly by the fluorimeter, and because of that, what may look like a peak in the complex’s spectrum might actually be a peak in the solvent’s spectrum. Finally, in determining the peaks, some are indeed too small to be seen on the emission spectrum, which leads to some ambiguity in determining which peak is for which electron.
References
Bassett, Andrew P., Steven W. Magennis, Peter B. Glover, David J. Lewis, Neil Spencer, Simon Parsons, René M. Williams, Luisa De Cola, and Zoe Pikramenou. “Highly Luminescent, Triple- and Quadruple-Stranded, Dinuclear Eu, Nd, and Sm(III) Lanthanide Complexes Based on Bis-Diketonate Ligands.” Journal of the American Chemical Society 126.30 (2004): 9413-424. JACS. 8 July 2004. Web.
Shi, Mei, Fuyou Li, Tao Yi, Dengqing Zhang, Huaiming Hu, and Chunhui Huang. “Tuning the Triplet Energy Levels of Pyrazolone Ligands to Match the 5D0 Level of Europium(III).” Journal of the American Chemical Society 44 (n.d.): 8929-936. JACS. 2 Nov. 2005. Web.
Swavey, Shawn, and Rochael Swavey. “Dinuclear and Polynuclear Lanthanide Coordination Complexes Containing Polyazine Ligands: Synthesis and Luminescent Properties.” Coordination Chemistry Reviews 253.21-22 (2009): 2627-638. Science Direct. SciVerse, 3 June 2009. Web.
Binnemans, Koen. “Lanthanide-Based Luminescent Hybrid Materials.” Chemical Reviews. Vol. 109. N.p.: n.p., n.d. 4283-374. Chem. Rev. 8 Apr. 2009. Web.
Jones, Richard, and Brad Holliday. Experiment 6: Synthesis and Characterization of Europium(III) and Terbium(III) Complexes: Construction of Energy Level Diagrams. 2013. Procedure. University of Texas, Austin, TX.
