Comparing Tris-2,2’-bipyridine Complexes of Iron (II) and Ruthenium (II) through Spectroscopy and Electrochemistry
Written by Johanna
ABSTRACT:
This experiment effectively determined the differences between Iron (II) and Ruthenium (II) Tris-2,2’-bipyridine complexes through the comparison of absorption and emission spectroscopy and cyclic voltammetry. In both the UV/Vis absorption and emission spectra, the Ru (II) complex shows far greater molar absorptivity values and fluorescence. The iron complex does not fluoresce. The MLCT peaks in the UV/Vis spectra correspond to the energy of the t2g à t2g* or HOMO à LUMO transitions, 2.64 x 10⁵ J/mol for Ru (II) and 2.30 x 10⁵ J/mol for Fe (II). This Ru (II) energy can also be compared to the energy gap between the HOMO and LUMO found on the CV, 2.43 x 10⁵ J/mol.
INTRODUCTION:
This experiment examines two d6 metal complexes with three 2,2’-bipyridine ligands. Both Ru2+ and Fe2+ are studied in the two complexes as [Ru(bpy)3](BF4)2 and [Fe(bpy)3](BF4)2.[1] Both ruthenium and iron are located in the same column of transition metals. However, iron is in the first row and ruthenium is in the second. For first row transition metals, the arrangement or the spin of the electrons are dependent on the ligand, not the metal. The second row transition metals, on the other hand, tend to be low spin. The high spin and low spin arrangements are as follows for d6 complexes:
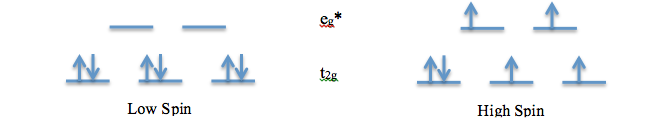
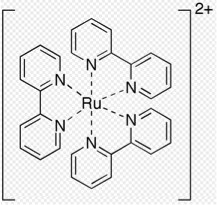 Figure 1. [Ru(bpy)3](BF4)2
The high and low spin diagrams show the arrangement of the electrons in the t2g and eg* molecular orbitals. The energy difference between these orbitals is referred to as the Δo. The energy gap between these orbitals varies depending on whether the complex is a metal π-acceptor, π-donor, or a σ-interaction. The π-donor system has the smallest Δo and an antibonding t2g* orbital. Weak ligands tend to give rise to such systems. The σ-interaction has a mid-range Δo and a non-bonding t2g orbital. The final system, π-acceptor, has the largest Δo and a bonding t2g orbital. It often arises from strong ligands. These systems are important in understanding the differences between the ruthenium and the iron complexes. For low spin complexes, the t2g orbital is the HOMO and πM orbital. The LUMO varies depending on the system. For metal tris-bipyridine complexes, the LUMO is the t2g* orbital. The transition from HOMO to LUMO for these complexes is πM à πM* or t2g à t2g*. This is also referred to as the Metal Ligand Charge Transfer (MLCT) as the bpy acts as a π acceptor.
EXPERIMENTAL DETAILS:
Materials: All of the experimental reagents were obtained commercially from Alfa Aesar and Fischer Scientific without alteration.
Physical Measurements: Hitachi U-2910 UV-Vis Spectrophotometer and F-4500 Fluorescent Spectrophotometer.
Synthesis of [Ru(bpy)3](BF4)2:
0.273 g (1.316 mmol) of Ru(Cl3) was dissolved in 10 mL of fluorescent dipropylene glycol and 1 mL of deionized water. The solution was heated and stirred and 0.558 g (3.57 mmol) of 2,2’-bipyridine (C10H8N2) was added. Once the bpy was dissolved, 0.184 g (1.04 mmol) of ascorbic acid was added to bleach the solution. The solution was heated to a boil for 15 minutes. It was cooled and diluted to 40 mL with deionized water and brought to approximately pH 8 with 2.5 M sodium hydroxide. The solution was precipitated with excess NaBF4 (4.943 g) and cooled on ice. The orange product was recovered through vacuum filtration with a percent yield of 91%.
Synthesis of [Fe(bpy)3](BF4)2:
0.12 g (0.947 mmol) of FeCl2 was dissolved in deionized water while 0.404 g (2.587 mmol) of 2,2’-bipyridine (C10H8N2) was dissolved in a small amount of ethanol. The two solutions were combined and a solution of excess NaBF4 in deionized water was added. The precipitate was filtered and washed with both cold water and ethanol. The maroon product was allowed to dry for a week and had a very low percent yield of 17%.
UV-Visible Spectra:
Both complexes were diluted to 25 μM in acetonitrile. The spectra were recorded from 850 to 250 nm. Calculations for the dilution are shown in the appendix.
Fluorescence Spectra:
The same solutions analyzed in the UV-Visible spectrometer were used to measure the fluorescence. However, before recording the spectra, each sample was purged with nitrogen gas. The excitation wavelength for each spectrum was set to match the absorption band recorded for each complex. The excitation wavelengths for the [Ru(bpy)3](BF4)2 and [Fe(bpy)3](BF4)2 complexes were 452 and 521 nm, respectively. The emission spectra were recorded from 400 to 700 nm.
RESULTS AND DISCUSSION
Both complexes were synthesized with little problem. As a reducing agent, Ascorbic acid plays a vital role in the syntheses. It was used to bleach the solutions, because it reduces ruthenium from the +3 to +2 oxidation state. Both metals studied in this experiment are in the +2 oxidation state and have a d6 configuration. The d6 confirmation has two possible states: low spin and high spin. Metal-to-Ligand Charge Transfer (MLTC) transitions in d6 low spin allows color in a complex. The synthesized Ru(II)complex, for example, is a red-brown-orange color due to this transition. These transitions can be seen in the UV-Visible Spectra.
The UV-Visible Spectra were recorded for both complexes. The ruthenium complex shows much higher molar absorptivity values than the iron complex. The spectra for both complexes are shown below in Figure 1:
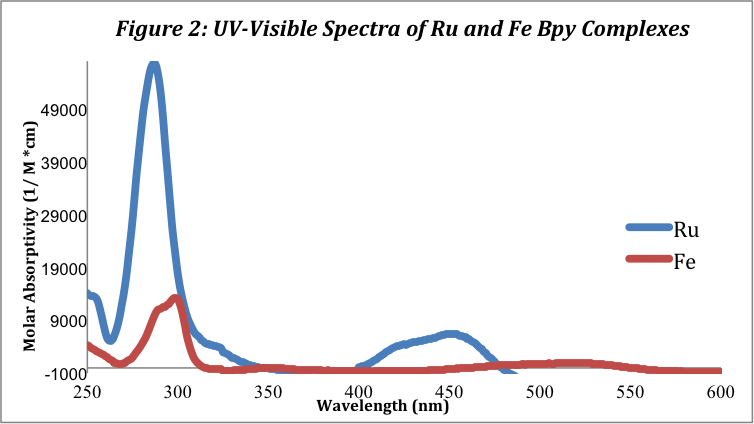
The ruthenium complex has a large peak at approximately 285 nm and a smaller peak at 453.5 nm corresponding to the MLCT band. This MLCT wavelength is close to the literature value, 452 nm, found in a study of metal tris-bpy complexes by Duchovnay.[2] The iron complex has similar peaks but of much smaller molar absorptivity values at 295 and 520 nm. These peaks and their corresponding molar absorptivity values are listed below in table 1:
|
Table 1: UV-Vis Data for Fe and Ru Complexes |
||||
|
Complexes |
λmax (LC) |
emax (LC) |
λmax (MLCT) |
emax (MLCT) |
|
[Ru(bpy)3](BF4)2 |
285 |
5.65E+04 |
453.5 |
6.43E+03 |
|
[Fe(bpy)3](BF4)2 |
295 |
1.21E+04 |
520 |
1.01E+03 |
The peaks in the UV section of the absorbance spectra (200-400 nm) correspond to the ligand charge transfer (LC), πàπ* transition. The emax values for the two metal complexes in this region vary greatly; the Ru (II) complex has a emax of 5.65 x 10⁴ M-1cm-1, towering over the Fe2+ emax of 1.21 x 10⁴ M-1cm-1. The peaks in the visible region of the spectra (400-700 nm) correspond to the metal-to-ligand charge transfer (MLTC). The molar absorptivity values for the peaks in the visible region are 6.43 x 10³ M-1cm-1 and 1.01 x 10³ M-1cm-1 for the Ru (II) and Fe (II) complexes, respectively.
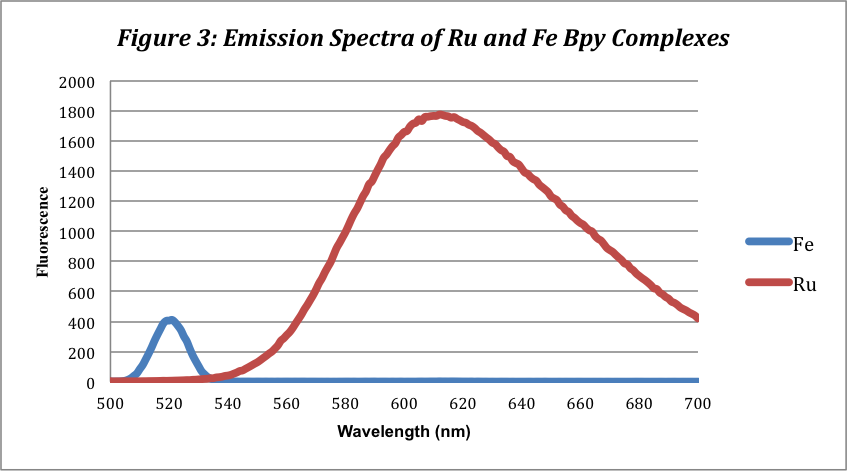
The fluorescence spectra for the complexes show one peak for each complex. Like the UV-Vis Spectra, the Ru (II) complex expresses the highest and broadest peak at 610 nm with a fluorescence of 1768. The Fe(II) complex has a far smaller and less broad peak at 518 nm with a fluorescence of 387. This peak, however, likely does not exist and is an error due to scattering at the 521 nm excitation wavelength. The iron complex does not fluoresce for unknown reasons.
Unfortunately, the two complexes were not able to be tested using cyclic voltammetry (CV). Although when performing a CV, it is necessary to purge the system with nitrogen gas to remove any oxygen. Oxygen can oxidize the complex being tested and interfere with the measurements. Since a CV could not be performed, a cyclic voltammogram was provided for the Ru(II) complex. The CV is provided in Appendix B with labeled peaks. The oxidation occurs in the direction of the positive current, as electrons are lost. The reduction is the opposite, occurring in the direction of the negative current. Four oxidation and four reduction processes are observed for the Ru (II) complex as it changes from the 3+ oxidation state to the reduced Ru(I) with an electron added to each of the two bpy ligands. The four peaks were labeled 1-4 in the CV and the E1/2 were calculated:
|
Table 2: Ru (II) CV |
||
|
Peaks |
E1/2 (V) |
ΔG1/2 (J/mol) |
|
1 |
0.875 |
-8.44E+04 |
|
2 |
-1.64 |
1.58E+05 |
|
3 |
-1.83 |
1.77E+05 |
|
4 |
-2.07 |
2.00E+05 |
Because the reference electrode information was not provided, the E1/2 and subsequent, ΔG1/2 values, are slightly off and do not match the values from absorbance spectrum peaks. The visible absorption maximum of the Ru (II) complex at the 453.5 nm (MLCT) peak corresponds to an energy of 2.64 x 10⁵ J/mol. This energy should match the energy gap of the first reduction and oxidation peaks, 2.43 x 10⁵ J/mol. This energy gap, however, does not consider the reference electrode and is consequently not equivalent. Although a CV for Fe (II) was not provided, the energy of the MLCT peak in the absorbance spectrum is 2.30 x 10⁵ J/mol, lower than both calculated values for Ru (II). The Ru (II) should have the larger energy gap as it is a 2nd row transition metal and is thus low spin. Therefore, the value of g is greater for the metal and there is larger splitting. Overall, the CV shows that the oxidation and reduction of ruthenium is quasi-reversible, because the oxidation and reduction peaks are not far from each other.
The MO diagram for the two tris-bpy complexes is shown in Appendix C. The HOMO and LUMO in both correspond to the t2g (πM) and t2g* (πM*) orbitals, respectively. The HOMO is metal based as only the metal contributes to it. The LUMO is ligand based. Thus, the transition of an electron from the HOMO to the LUMO is called “Metal-to-Ligand Charge Transfer.” The MO diagrams of the two metals differ in the energy difference between the HOMO and LUMO orbitals, and consequently, the Δo, which ranges from the t2g to the eg* orbitals. The t2g*, or the LUMO, falls between the t2g (HOMO) and the eg* orbitals as shown. These energy differences between the two metal complexes are confirmed by the prior discussion of the HOMO à LUMO energy change found in the absorption spectra.
The energy of the MLCT can also be examined through a quantum mechanical lens. Both the total angular momentum and the total spin angular momentum of an atom affect its energy. To examine the effects of these two interactions, the spin orbit coupling value is used. Spin orbit coupling effectively couples the effects of spin angular momentum, S, and orbital angular momentum, L. The intensity of MLCT transitions in [M(bpy)3]2+ complexes are proportional to the squared spin orbit coupling constant (λ2) of that metal. The spin orbit coupling constant for Ru (II) is 1200 cm-1 and 400 cm-1 for Fe(II).2 Squaring these values only makes them larger. The Ru (II) complex’s large λ2, 1.44 x 106 cm-1, is proportional to the very large molar absorptivity at the MLCT band. Similarly, the far smaller MLCT band in Fe (II) corresponds with the smaller λ2 value, 1.6 x 105 cm-1.
CONCLUSION:
From this experiment, the energy differences between the HOMO and LUMO in both [Ru(bpy3)]2+ and [Fe(bpy3)]2+ are examined through the UV/Vis absorption spectra, the emission spectra, and the CV of Ru (II). The wavelength of the MLCT peaks on the UV/Vis spectra directly correspond to the energy change between HOMO and LUMO. This energy for Ru (II) was 2.64 x 10⁵ J/mol. The Fe (II) complex had both a lower molar absorptivity and a lower energy change with 2.30 x 10⁵ J/mol. This HOMO to LUMO energy gap can be compared to the energy change extracted from the CV for Ru (II). The Ru (II) CV showed an energy gap of 2.43 x 10⁵ J/mol. This value is slightly lower than the energy calculated form the absorption spectrum as the reference electrode was not accounted for in the CV data. The difference in the HOMO to LUMO energies and the subsequent variations in the Δo values for the two complexes can be seen in the MO diagrams. The fluorescence spectra show strong fluorescence in the Ru (II) complex, but no fluorescence in the Fe (II) complex. While this exact phenomenon is not understood, it still effectively distinguishes the two complexes.
Overall, the experiment successfully distinguished the two compounds. Of the literature values found, the experimental values nearly matched. Future examination of the metal-bpy complexes may include osmium, which is directly below ruthenium in the periodic table. A 1981 paper by Ceulmans and Vanquickenborne claims that the absorption spectrum of the [Os(bpy3)]2+ complex is very complicated.[3] It may be interesting to perform a CV and fluorescence spectra of the compound, which the paper did not discuss, to see if any similarities between the Ru (II) and Os (II) exist.
APPENDIX:
Calculations:
[Ru(bpy)3](BF4)2:
MW = 743 g/mol
0.273 g RuCl3 (1 mol / 207.43 g) = 1.316 mmol
0.558 g bpy (1 mol/ 156.18 g) = 3.57 mmol
1 mmol ascorbic acid (1 mol/1000 mmol) x (176.12 g/ 1 mol) = 0.176 g
1.316 x 10⁻³ mol RuCl3 (1 mol product / 1 mol RuCl3) x (743 g/ 1 mol) = 0.978 g
% yield = 0.889 g/0.977 g = 91%
[Fe(bpy)3](BF4)2:
MW = 697.94 g/mol
0.12 g FeCl2 (1 mol/ 126.751g) = 0.947 mmol
0.404 g bpy (1 mol/156.18 g) = 2.587 mmol
0.947 x 10⁻³ mol FeCl2 (1 mol product/1 mol FeCl2) x (697.94 g/1 mol prod) = 0.661 g
% yield = 0.1108 g/0.661 g = 17%
Sample Calculations:
Dilution for Spectrophotometric Analysis
2.5 x 10-5 = x/0.025 L
x = 6.25 x 10⁻⁷ mole
6.25 x 10⁻⁷ mol [Ru(bpy3)](BF4)2 x (743 g/1 mol) =0.00046 g
0.0005 g weighed (1 mol/743 g) = 6.73 x 10⁻⁷ mol [Ru(bpy3)](BF4)2
E = hc/λ * NA
E = [(1.98644568 x 10⁻²⁵)/(453.5 x 10-9)] x NA
E = 2.64 x 10⁵ J/mol Ru (II)
[1] http://en.wikipedia.org/wiki/Tris%28bipyridine%29ruthenium%28II%29_chloride
[2] Duchovnay, Alan. “Comparative electrochemistry, electronic absorption spectroscopy and spectroelectrochemistry of the monometallic ruthenium polypyridyl complexes” Virginia Polytechnic Institute and State University, 2011. http://scholar.lib.vt.edu/theses/available/etd-04252011-111102/unrestricted/Duchovnay_A_T_2011_1.pdf
[3] Ceulmans, A. & Vanquickenborne, L.G., “On the Charge-Transfer Spectra of Iron (II)- and Ruthenium (II)- Tris(2,2’-bipyridyl) Complexes” J. Am. Chem. Soc. 1981, 103, 2238-2241. http://pubs.acs.org/doi/pdf/10.1021/ja00399a017.
