Determining the Equilibrium Constant of Bromothymol Blue
Written by Lisa
Abstract
Bromothymol blue is an indicator used to detect weak acids and bases. In acidic solutions, it appears yellow, in basic solutions it is blue, and in mid pH ranges, it is green. By determining the absorbance values of solutions at all of these extremes, the equilibrium constant (Kc) of this indicator can be calculated. After taking the spectra of each the yellow, the blue and the green solutions, a Kc value of (1.2 ± 0.19) M and a pKc value of 7.0 ± 0.2 were calculated. When comparing the calculated value to a literature pKc value of 7.1, there is a percent difference of 1.4%.
Objective
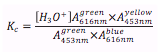
Bromothymol blue is a chemical indicator that appears yellow in very acidic conditions, blue in basic conditions, and green in mid pH ranges. This experiment will determine the equilibrium constant of this indicator by comparing the absorbance of a buffer solution containing bromothymol blue at its yellow, blue and green states. After the spectrum of each solution is taken, the following equation can be used to determine the equilibrium constant (Kc).
However, to account for the fact that multiple species (different colors) of the bromothymol blue that may exist in the solution at one time, the revised equation below subtracts the absorbance of the invading species from the one of interest.
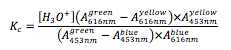
This gives a more accurate depiction of the calculated equilibrium constant of bromothymol blue.
Results
From the spectra of each solution (Figure 1), absorbance values at 453nm and 616nm were collected (Figure 2). The concentration of hydronium ions, [H3O+], is determined from the initial pH reading of the sodium phosphate buffer made (Equation 1).
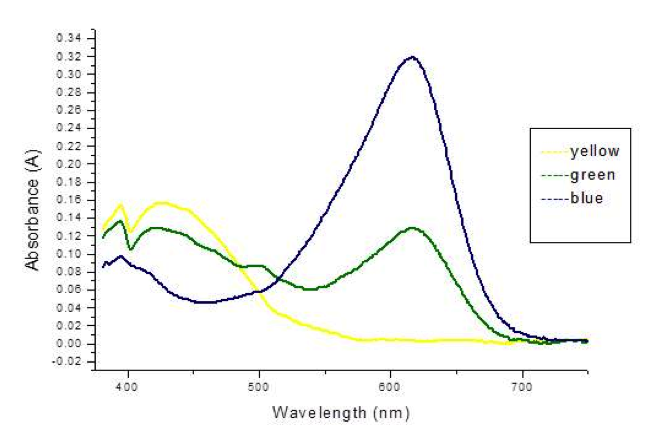
Figure 1: A graph showing the spectra from 375nm to 750nm of each of the different bromothymol blue solutions.
| A453nm | A616nm | |
| Blue | 0.046 | 0.319 |
| Green | 0.111 | 0.128 |
| Yellow | 0.141 | 0.003 |
Figure 2: A table of absorbance values for each of the 3 bromothymol blue solutions at 453nm and 616nm.
![]()
Equation 1: Determining the concentration of hydronium ions.
With these values, the equilibrium constant can be calculated via the equation that adjusts for alternative absorbance values (Equation 2). The calculated Kc value can then be converted to a pKc value for better comparison to a literature source (Equation 3).
![]() Equation 2: Determining the equilibrium constant
Equation 2: Determining the equilibrium constant
![]() Equation 3: Determining the pKc value for literature comparison.
Equation 3: Determining the pKc value for literature comparison.
Thus, the calculated equilibrium constant for bromothymol blue is 1.12 , with a pKc value of 6.95.
Error Analysis
The error in pH values was determined to be ± 0.03 units, and for all absorbance values, there is an error of ± 0.002. With these error values, a total standard deviation associated with Kc can be calculated.
[H3O+] relative variance: (0.03)(2.303)2 = 0.159114, variance = 0.159114[H3O+]
= 0.159114(1.31) = 2.09753
[H3O+] = (1.3 ± 0.2)M
![]()
Determination of the total error for subtraction values:
0.128 ± 0.002 – 0.003 ± 0.002 = 0.125 ± 0.003
![]()
0.111 ± 0.002 – 0.046 ± 0.002 = 0.065 ± 0.003
With all corrected error values:
![]()
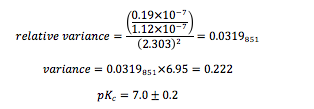
To incorporate errors into this calculation:
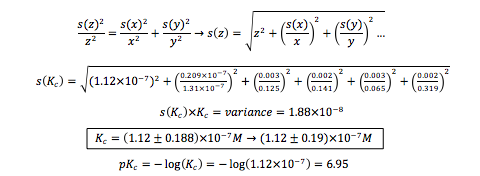
Variance in pKc:
Comparing to the Literature Value:
![]()
Discussion and Conclusion
According to the data, the calculated equilibrium constant of the bromothymol blue indicator was (1.2 ± 0.19) M, which translates to a pKc of 7.0 ± 0.2. When compared to the literature pKc value of 7.1, the percent difference is 1.4%. The calculated value may have disagreed slightly because the calibration curve of the pH meter used was only 90.0. This means that the hydronium concentration calculated may be slightly off, thus throwing off the equilibrium value. Error may have also occurred during the spectrum readings since a SpectroVis Plus reader that correlated with Logger Pro 3 was used instead of a more sophisticated UV-Vis spectrometer. To improve the results, a more sensitive spectrometer and a single cuvette could be used to gain all solution spectra.
References
Klotz, E., Doyle, R., Gross, E., Mattson, B., J. Chem. Ed.,2011 88 (5), 637-639.
