A Practical Use for Paper Chromatography
A Practical Use for Paper Chromatography
By: Matthew Schweitzer
Introduction:
Chromatography is a major operation used in many different operations in chemistry. Chromatography is a method of separation in which the components of a substance are separated and distributed between two phases which are the mobile phases and stationary phase.1 There are different methods of chromatography. These include column chromatography, planar chromatography (paper chromatography), development chromatography, elution chromatography, retention chromatography, gas chromatography, and liquid chromatography.2 The experiment that was conducted was planar chromatography but will be referred to paper chromatography throughout this report. The purpose of chromatography is to identify different components such as the ink in a pen. What we can do is put an ink through the chromatographic process, then identify it with a known sample thus finding the identity of a former unknown ink.
Before delving into the procedure it is important to explain how chromatography came into the chemistry world. Chromatography was first invented by a man named Mikhail Tswett. His project involved separating naturally occurring chlorophylls. Funny enough, Tswett thought the process he used was rubbish and the idea of chromatography was dismissed from scientists for thirty or so years. Eventually, Martin and Synge used chromatography but in a different way. They invented paper chromatography because the column in column chromatography was unable to separate dicarboxylic acids.6 For their amazing work they received the Nobel Prize.1
Paper chromatography takes place on a special piece of paper that has cellulose which contains hydroxyl groups. These hydroxyl groups hydrogen bond with water. As stated before, there is a mobile phase and a stationary phase. The water that hydrogen bonds with the hydroxyl groups acts as the stationary phase. The mobile phase is the liquid moving through the pores in the paper.1
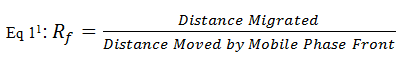
Paper chromatography is carried out as follows. Samples (of ink or dye) are placed on the paper and distributed evenly. Then, the paper is rolled and stapled. The bottom of the paper (where the samples are) is submerged in a solution. This solution can vary as you will see in the procedure. The sample will then spread. The more polar the substance is, the less it will spread. After the process is complete Rf samples can be determined. Rf stands for retention factor and it is basically a way of finding how polar the sample is. It is the distance moved by the component divided by the distanced moved by the mobile phase front. The mobile phase front is basically where the farthest component has travelled. Therefore a very nonpolar substance will have an Rf of close to one while a very polar substance will have a very small Rf value.
In this laboratory, paper chromatography was used to identify ink samples. However, there are many other methods that identify ink samples. Capillary Electrophoresis is one.3 Microscopy is another. Microscopy is exactly what it sounds like. Using a very strong magnifying lens, ink samples can be compared to others without actually putting the sample in a chemical test.4 This may be more of a preferred method because the evidence will not have any chance of being destroyed, however, human error could be a large factor. Another rather new way of verifying ink samples is through a “library” of ink profiles where forensic scientists will compare the mass spectrometry of one ink sample with something called Direct Analysis of Real Time (DART). This reveals the chemical makeup of ink quicker than ever.5
In this lab, the goal was to create a solution of the most ideal polarity to send chromatographs through. After a standard amongst the group was found (the best looking sample) two solutions in which our chromatographs were submerged was agreed upon. After we received unknowns our goal was to put it through chromatography and identify the ink samples with the standard we agreed upon. To achieve best results and have the best chance to identify unknowns, the stationary phase must be as polar as possible without being just water. Therefore, 1 part methanol, and 2 parts water should yield a polar solution that will not allow our ink sample (mobile phase) to travel as far. This solution of 1 part methanol and 2 parts water will have a polarity of 8.2 according to the Snyder Index which is shown in Table 1 below. When the original chromatograph was made using different food dyes (this will be explained in the Procedure section) the polarity was 5.87 and the ink travelled much too far. Therefore, the more polar the stationary phase is, the less distance travelled, and the better the results will be.
Procedure: From PSU Chemtrek 2013-2014 pp. 17-11-17-211
Before any unknowns were identified and any solutions made, we had to first understand how chromatography worked. Section A helped prepared us to do just that. The first step was to get one piece of chromatography paper and label it. To label it I had to measure 0.5cm from the bottom of the paper and draw a line all the way across the paper. Then I measured every 1 cm and put a hash mark. A capillary tube was made for the transfer of dyes and were placed on each hash mark. I then made a cylinder out of my paper and stapled it leaving a slight gap. I made a solution of 2:1 1-proponal/water and placed it in a petri dish. The paper was then placed in the solution with the mobile phases closest to the solution and placed a cup over it. The process took about 20-25 minutes until it was complete. When the paper was dried the solvent front was determined and the Rf values were found. It was from this part of the experiment that I realized the ink has spread too far and that a different solution needed to be made. I was also able to identify all the components of the dyes that were made up of more than one. These included, cheddar cheese, grape Kool-Aid, Lemon-Lime Kool-Aid, Orange Kool-Aid, and a dye made by my partner, Chris Schmidt. He made the dye because we shared the dyes and samples initially. The samples that a mixture of components were determined solely by the Rf values.
This was the gateway to creating my own solution to determine the unknown samples. Initially each member of the group, Grei, Ryan, Chris, and I made one. Grei’s solution was 2 parts methanol and 1 part water. It is noted that we did not necessarily pick random combinations of water and an alcohol. The Snyder Index gives relative polarity values up to 9. Water has the value of 9 and it is the most polar. (See Table 1 below for the Snyder index) To determine polarity by the Snyder index, the values of each part are added up and divided by the number of parts in the solution. Therefore Grei’s sample has a polarity total of 7.4 which is 2 parts methanol and one part water. Ryan made a solution of 6.93 with 1 part methanol, 1 part ethanol, and 1 part water. I made a sample of 8.6 polarity with 5 parts water and 1 part methanol. Chris made a solution of 8.2 polarity with 2 parts water and 1 part methanol. After making a chromatograph and listing putting a sample of each of our 15 pens we ran the first test. After the testing was done, we each did one more test with different polarities that we thought would be better based on our first polarities. This time I made a solution of 8.0 polarity which consisted of 3 water and 1 ethanol. Grei ran a 7.56 polarity which consisted of 3 parts water, 2 part methanol, and 1 part ethanol. Ryan ran a 7.8 sample which consisted of 1 methanol and 1 water. Lastly, Chris ran a 7.76 sample which was 3 parts water, 1 methanol and 1 ethanol. The reason why all these were picked will be discussed in the “discussion” section.
|
Snyder Index10 |
Table 1 |
| Substance | Polarity |
| 1-Proponal | 4.3 |
| 2-Proponal | 4.3 |
| Ethanol | 5.2 |
| Methanol | 6.6 |
| Water | 9.0 |
Results:
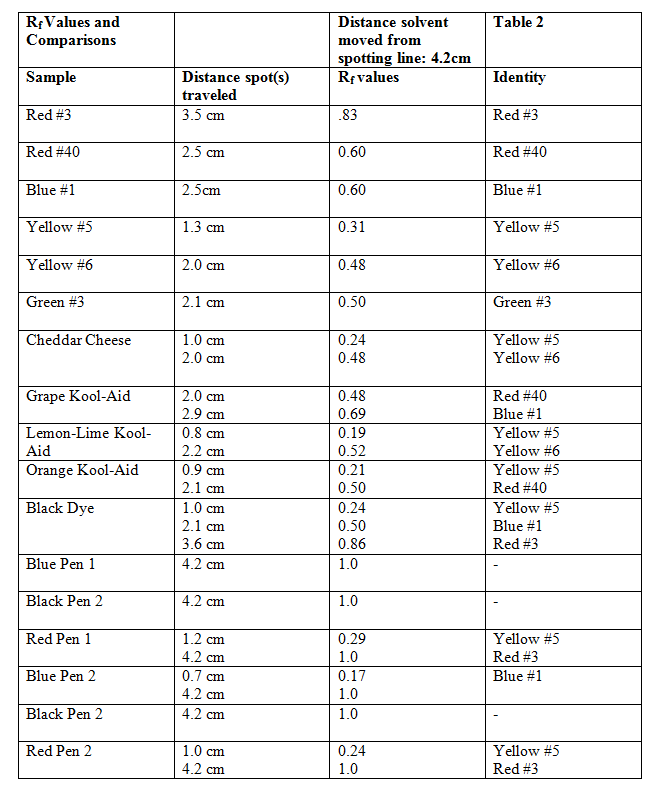
I will begin by showing the results of the very first chromatograph ran and briefly describing what was seen. I will move on to each chromatograph in order until are shown and briefly explained. I will also show the initial list of different dyes such as the cheddar cheese and the Kool-Aid just to show that Rf values can be useful, however, they were not useful in the ink experiment.
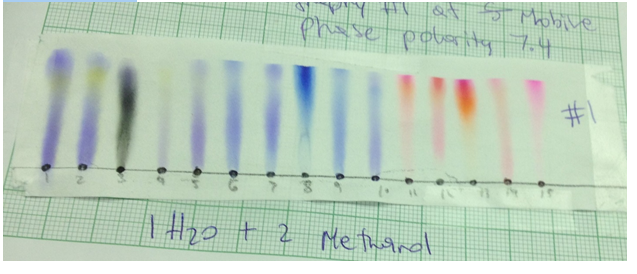
Chromatograph 1 below shows my very first chromatograph ran in 2:1 1-propanol/water.
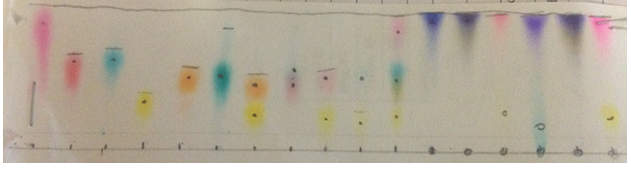
Samples 1-11 from left to right were all food dyes and combinations. 12-17 were inks. As you can see the 2:1 1-propanol/water was not polar enough and the inks went all the way to the mobile phase front. This is why the different solutions were to be made. Also the dots show where to measure for the Rf values. The next table (table 2) will show how I compared the mixture with the dyes.
Table 2
*Note: These samples are in ordered as shown in Chromatograph 1.
The equation for Rf is given in equation 1
In all the chromatographs made, the ink samples are in order from the left to right with the following inks listed in table 3.
Table 3
| Order of Inks | Color | |
| 1 | Paper Mate | Black |
| 2 | Bic | Black |
| 3 | Pilot Vball | Black |
| 4 | Pilot Easy Touch | Black |
| 5 | Staples | Black |
| 6 | Paper Mate | Blue |
| 7 | Bic | Blue |
| 8 | Pilot Vball | Blue |
| 9 | Pilot Easy Touch | Blue |
| 10 | Staples | Blue |
| 11 | Paper Mate | Red |
| 12 | Bic | Red |
| 13 | Pilot Vball | Red |
| 14 | Pilot Easy Touch | Red |
| 15 | Staples | Red |
Chromatograph 2 shows my first trial with the 8.6 polarity (5 parts water, 1 part methanol)
Chromatograph 2
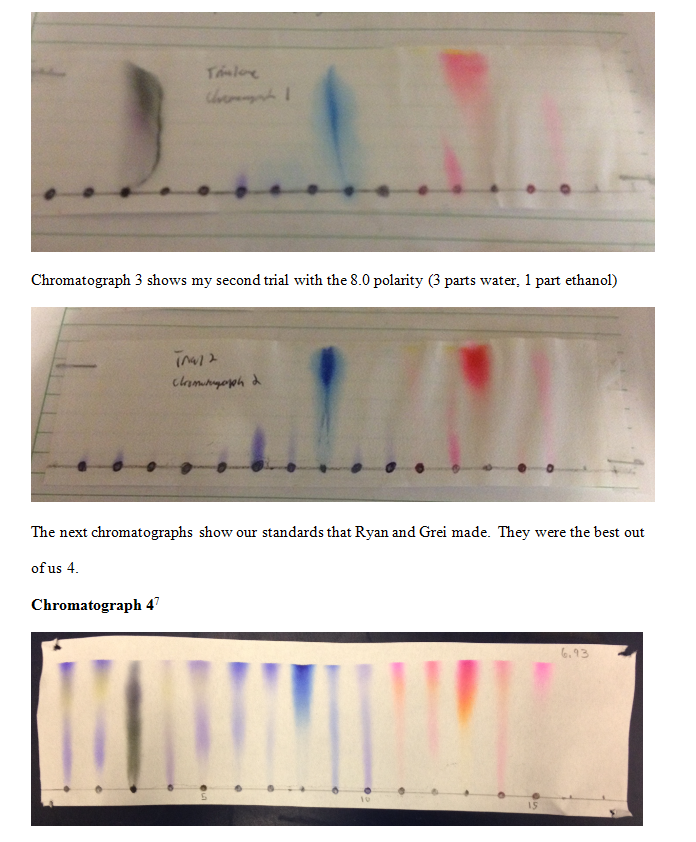
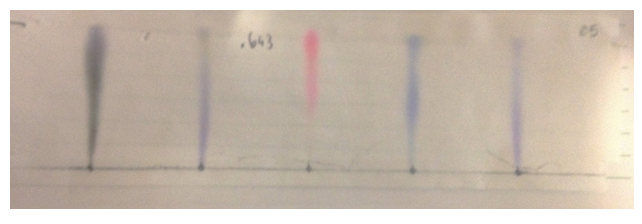
Chromatograph 4 was the standard that Ryan made. It had a 6.93 polarity and was made of 1 methanol, 1 ethanol, and 1 water.
Chromatograph 58
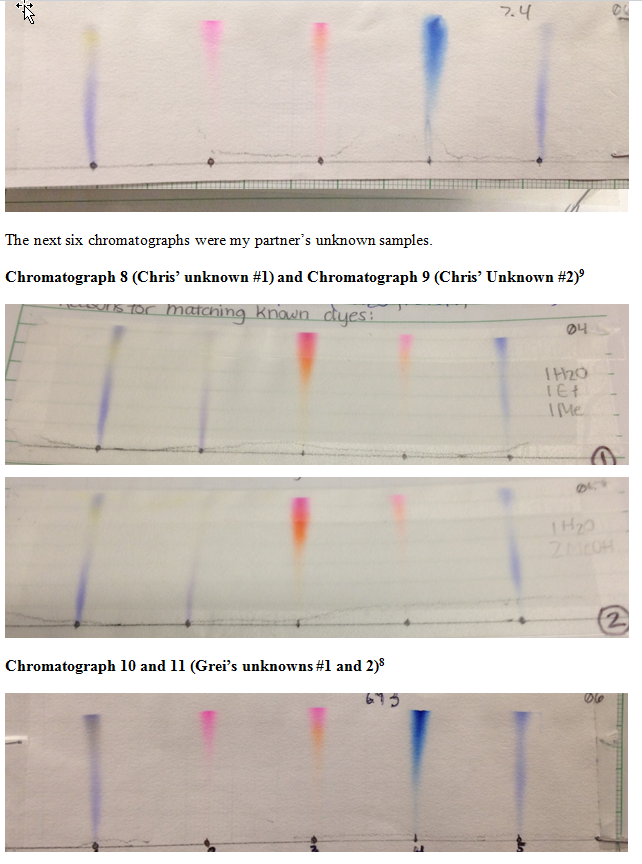
Chromatograph 5 was made by Grei has 1 part water and 2 parts methanol. Its polarity was 7.4.
Chromatographs 6 and 7 were my unknowns with 6.93 polarity (1 water, 1 ethanol, and 1 water) and .740 (2 methanol and 1 water) respectively.
The following chromatographs (six and seven) were the unknowns that I ran with a polarity of 6.93 (1 part methanol, 1 part ethanol and 1 part water) and 7.40 polarity (2 parts methanol and one part water)
Chromatograph 6
Discussion:
The initial chromatograph was carried out to understand how to run chromatography, to understand how to use Rf values, to identify the components of substances such as Cheddar Cheese and Kool Aid, but most importantly to see that the ink samples are too difficult to measure with the polarity of the solution we used. Referring to table 2, we can see all the dyes, inks, and substances that were carried out. This was not vital to the experiment so I will not go into great detail about it. However, it shows that the Rf values are unmeasurable for the most part for the ink samples.
Table 3 shows the ink samples are they are put on chromatographs in order from left to right. As you can see there are three different colors of ink and 5 different brands. These are Paper Mate, Bic, Pilot Vball, Pilot Easy Touch, and Staples.
At last, the first chromatograph (chromatograph 2) vital to this experiment was ran. This has 1 part methanol, and 5 parts water. Its polarity was 8.6. As one could tell many of the samples did not move whatsoever. Other samples did move such as Pilot Vball black, Pilot Easy Touch blue, Bic red, Pilot Vball red, and Pilot Easy Touch red. I would never use that chromatograph if I was working alone because some did not move, and if you look at Pilot Vball Black, it shifted to the right. This suggests human error. It was disturbed during the chromatograph process. Nonetheless, the ones that did not move were very polar just like the stationary phase. If one recalls, the distance traveled by a sample increases and polarity decreased. More simply put, if a sample is nonpolar, it will be higher up on the chromatograph. This sample was definitely not used to test my unknowns.
The second chromatograph (chromatograph 3) was ran with a less polarity. It was made with 3 parts ethanol and 1 part water. Its polarity was 8.0. The observation that can be made with this one is that it is still too polar. Many of the inks did not move once again and the ones that did move do not look well. Inks number 6-15 (table 2) did move at various distances. It was determined by the Chris, Grei, Ryan and I, that the samples that should be used for standards to compare to our unknown samples were chromatograph 4 and chromatograph 5. When we selected our solutions with high polarities we more or less picked random mixtures but with high polarity. Therefore after all of our chromatographs were ran we all judged and decided that the best were chromatograph 4 and 5. And, as you can observe, the spreading was very nice and the colors were very bright and differentiated. Chromatograph 4 has a polarity of 6.93 with 1 part methanol, 1 ethanol, and 1 water. Chromatograph 5 has a polarity of 7.4, made with 2 methanol, 1 water. There are not many significant differences between the two. This however, does more or less prove my initial hypothesis incorrect because my samples which were the most polar proved to be the worst, and quite frankly rather ugly.
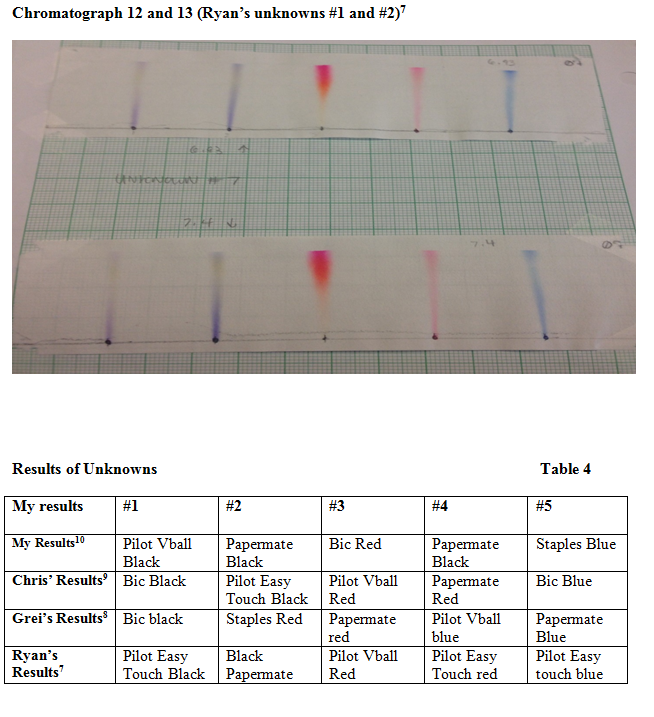
The main goal of this experiment was to use chromatography techniques to identify unknown ink samples with known ink samples. Chromatograph six and seven were my unknown samples that were ran with different solutions to hopefully get the best output. Looking at chromatographs six and seven, my first unknown was very clear. It was in Pilot Vball black. The second was rather hard to identify and I did incorrectly pick two times. The first time I guessed Pilot Easy Touch black, then I guess Bic black. But, it turned out to be Papermate black. The third unknown gave me a struggle too. I picked Pilot Easy Touch red and Papermate red. It turned out to be Bic red. The fourth unknown was blue Papermate but I guessed Staples blue and Pilot Vball blue. I guessed the last one right thankfully which was Staples blue.
Before I delve into the analysis of the unknowns, why I picked them, and why I think I was wrong, I will explain why the two solvents my group used were the best. When we ran our standards the 6.93 (1 water, 1 ethanol, 1 methanol) polarity and the 7.40 (1 water, 2 methanol) polarity were the best because the spreading occurred very neatly and all inks were easily noticeable after the chromatography took place. The polarities were very polar but not so much to where they did not spread at all like my first chromatographs did.
When the unknown chromatographs were ran through, there was not much noticeable difference between the two. The 6.93 polarity sample came out slightly clearer than the 7.40 polarity sample so I basically only focused on that sample. Although, I tried to make determinations I failed on three out of the five samples. Nevertheless, the first sample was definitely the easiest because of the deep black into a purple shade it made. As stated before this was Pilot Vball black. The second I noted a purple color with a slight yellow at the end. Unfortunately there were three or four that appeared this way in our standards. To me it looked identical to Pilot Easy Touch but it turned out to be Papermate black which does not show as much resemblance. The third was also a toss-up. It started with a very light pink and went into a hot pink color. Many of the samples showed orange in our standard for the red inks but not so much a hot pink. I picked Pilot Easy Touch because of the lighter pink. Then I picked Papermate red due to the light base onto a deep pink. It turned out to be Bic red. My fourth unknown was by far the most difficult. I noted the start and end of the spreading was light blue and the middle was the darkest. With that observation I chose Staples blue and Vball blue because of the similarity. Looking back I do not understand why I chose Vball blue but it was probably due to frustration. It turned out as said before to be Papermate Blue. I could not put those together initially because my unknown had such a thin line. Lastly, my fifth unknown was staples blue. They both had the same color, but oddly my line was very thin. Perhaps my unknown chromatographs were made with a solution that was too polar or it was made poorly due to my error.
It is also important to note that although my chromatograph unknowns appeared very thin so did my partner’s. I think this had to do with how much ink was given on the paper initially.
Conclusion:
This experiment’s main goal was to explore the technique of paper chromatography and use the technique to do something that is so often used in forensic chemistry which is identify a sample. In this case, the samples were ink. Initially, we ran a paper chromatography of different things such as Kool Aid and cheddar cheese, as well as food dyes and ink. We saw that the ink would spread too far. Thus, a hypothesis was made to minimize the spreading of the ink samples. The hypothesis was stated in the introduction section. The main point of the hypothesis was that the more polar the solvent is, the less the spreading will occur and the better the results. The reason you would want it to be more polar is because non polar substances travel further in chromatography. Therefore, if the solvent is more polar, the ink will not travel as far due to the bonding that occurs. Ink would be considered more non-polar comparing it to food dye (see chromatograph 1). Now, I can safely conclude that this hypothesis is incorrect. The reason being is when I ran the most polar chromatography of the group, some of my inks did not spread whatsoever. Therefore, the ideal solvent must be polar, but not so polar that the inks do not travel whatsoever. We have determined that something with 6.93 polarity and 7.40 polarity is the best. These polarities are based off the Snyder Index of course. Besides forming a hypothesis and deeming it correct or incorrect, the other goal of this experiment was to identify unknown ink samples with known ink samples. I had particularly a hard time with this because my unknowns would look very similar to two or more of the known samples that we produced. Therefore, it was rather a game of chance. A UV light was provided but I did not have the opportunity to look through it due to time. Even so, I do not think the UV light would have been much help. My unknowns also did not come out with the best clarity compared to our standards for some reason. This could be due to my error at measuring the solvent correctly or possibly not enough ink to spread. Nevertheless, I still was able to safely identify two of the unknowns. If I were doing this ink sample for a forensic chemistry job I would run many more tests and use many different techniques until I would safely provide match and unknown with a known.
References
1) Thompson, Stephen. “Paper, Thin Layer, and Liquid Chromatography” Ed. Joseph T. Keiser. PSU Chemtrek. 2013-2014 ed. pgs 17-1-17-22. Plymouth, MI: Hayden McNeil. 2013
2) “chromatography.” Encyclopaedia Britannica. Encyclopaedia Britannica Online. Encyclopaedia Britannica Inc., 2014. Web
3) Egan, James, Kristin Hagan, and Jason Brewer. Washington DC. FBI. Forensic Analysis of Black Ballpoint Pen Inks Using Capillary Electrophoresis. Print. <http://www.fbi.gov/about-us/lab/forensic-science-communications/fsc/july2005/research/2005_07_research01.htm>.
4) Radley, Robert. “Work Undertaken.” Docexam. N.p., n.d. Web. 18 Feb 2014. <http://www.docexam.co.uk/ink_analysis.html>.
5) DOE/Ames Laboratory. “New Ink Sampling Technique Taking A Bite Of Out Time.” ScienceDaily. ScienceDaily, 19 July 2007. <www.sciencedaily.com/releases/2007/07/070718001516.htm>.
6) Ettre, Leslie. Milestones in Chromatography. 19. Eugene, Oregon: 2012. 506-512. Print.
7) Shenigo, Ryan. Chem 113 Notebook. Pennsylvania State University.
8) Shele, Grei. Chem 113 Notebook. Pennsylvania State University.
9) Schmidt, Chris. Chem 113 Notebook. Pennsylvania State University.
10) Schweitzer, Matthew. Chem 113 Notebook. Pennsylvania State University.
