Spectroscopy & Protein Characterization: SDS PAGE and Spectroscopic Analysis of an Unknown Protein
Written by Emily
ABSTRACT: Characterizing proteins is useful for determining structural, functional, and other biologically important information. In this experiment, an unknown protein (E) was analyzed, and was found to weigh approximately 50kDa (50,000 g/mol) and have a concentration of 1.56 mg/mL. This data was found using absorbance spectroscopy and SDS-PAGE. These are just two techniques for analyzing proteins out of a plethora of techniques available, and the data gathered from these techniques is useful, but not enough to form a larger idea of what this protein is or provide any functional insight. In this experiment, we focus on the techniques used and how they could be useful in the scope of determining additional information about proteins.
Defining the characteristics of proteins aids in amino acid sequencing, structural interpretation, and may provide some functional information that could prove useful in protein synthesis. Finding those characteristics experimentally can be done in a variety of ways, and each method provides useful pieces of information that can be used in conjunction with one another to produce a better image of the protein as a whole. In this experiment, SDS-PAGE and UV-VIS absorption spectroscopy are utilized to determine a few of the basic characteristics of an unknown protein. The information obtained from these methods is not sufficient for identification, but rather provide some of the characteristics of the unknown protein.
Amino acids do not absorb light in the visible range of the electromagnetic spectrum, and because of this, analysis with UV-VIS spectrometers is difficult, if not impossible1. Using the Bradford assay method, the protein sample is dyed using Coomassie Brilliant Blue dye. This dye binds to the protein in the sample, and the maximum absorption wavelength shifts from 465 nm to 595 nm when in this bound state. The higher the concentration of the protein; the higher the absorption will be at 595 nm. This method involves measuring a known sample of known concentrations (several dilutions) over a fairly broad range to create an absorbance vs. concentration curve, and the linear range can be used to create an equation specific to those ranges. Then, when the absorbance of the unknown protein is recorded, the equation of the line can be used to find the concentration of the unknown. This method is not flawless; when using an unknown protein, the standard may bind differently to the dye than the unknown, which is a possible source of error2.
|

This experiment uses BSA as the standard protein, which has a high number of reactive amino acid side chains that cause it to bind very effectively to the dye (which may or may not reflect the binding affinity of the unknown protein)2.
|
Another technique utilized in this lab is SDS-PAGE, or sodium dodecyl sulfate-polyacrylamide gel electrophoresis. This is useful for determining the approximate molecular weight as compared to a standard mixture of proteins. The theory behind electrophoresis involves measuring the movement of charged molecules through a medium (in this case, polyacrylamide gel) when an electric field is generated through the medium. In general, electrophoresis can separate molecules based on size, shape, charge, and structure as these characteristics diffuse through the medium at different rates. In SDS-PAGE, sample proteins are denatured with the SDS detergent to unfold the non-polar regions and to uniformly distribute charge. Utilizing β-mercaptoethanol, disulfide bonds can be broken and would yield multiple lines if the subunits are not equivalent (if they are equivalent, they travel through the gel at the same rate, and appear as a single line). The bands corresponding to the various proteins are deposited at different points in the medium. The medium is dyed to make visible bands, which show the spots in the medium that the molecules are deposited. Larger molecules take longer to diffuse through the gel matrix, and are deposited near the top of the gel. Smaller molecules travel faster, and are found closer to the bottom of the gel. Using a standard protein mixture as a reference, an unknown sample can be measured against a variety of known proteins (which should be listed with corresponding molecular weights on the standard solution) to estimate the molecular weight of the unknown protein and/or its subunits2.
EXPERIMENTAL PROCEDURE:
Materials. For the spectroscopy portion of the experiment, a Vernier SpectroVis Plus spectrometer was used to measure the absorbance of the BSA standard (2mg/mL) purchased from Bio-Rad Laboratories, Inc. (Hercules, CA). The dye used was an acidic mixture of Coomassie Brilliant Blue G-250 purchased from Bio-Rad Laboratories, Inc.(Hercules, CA). The electrophoresis apparatus used was a Mini-Protean III Gel Electrophoresis Apparatus, purchased from Bio-Rad Laboratories, Inc. (Hercules, CA). Tris, SDS, Acrylamide:Bisacrylamide, and APS were purchased from Fisher Biotech Pty. Ltd. (Wembley, WA). TEMED was purchased from Fischer Scientific (Pittsburg, PA). Laemmli Sample Buffer, 10 X Running Buffer, and protein standards were all purchased from Bio-Rad Laboratories, Inc. (Hercules, CA).
Methods. For the spectroscopy portion of the experiment, we followed standard procedure as outlined in the Instruction Manual3. In making the absorbance curve, we diluted the standard BSA (2mg/mL) to concentrations of 0.2 mg/mL, 0.35 mg/mL, 0.55 mg/mL, 0.75 mg/mL, and 0.9 mg/mL. For the electrophoresis portion of the experiment, we followed standard procedure as outlined by Bio-Rad3, using a 5% stacking gel and a 10% resolving gel using the following recipe:
|
Reagent |
5% stacking gel (total volume, 2mL) |
10% resolving gel (total volume, 5mL) |
|
Deionized Water |
1.2 mL |
2.38 mL |
|
Buffer |
0.5 mL of 0.5M Tris buffer @ pH 6.8 |
1.25mL of 1.5M Tris buffer @ pH 8.8 |
|
10 % SDS |
20 μL |
50 μL |
|
40 % Acrylamide:Bisacrylamide |
250 μL |
1.25 mL |
|
10 % APS |
20 μL |
50 μL |
|
TEMED |
10 μL |
20 μL |
Table 1. Polyacrylamide gel recipe.
We prepared a 0.5 M Tris buffer at pH 6.8 for the stacking gel, and a 1.5M Tris buffer at pH 8.8 for the resolving gel in the laboratory. Additionally, we prepared the SDS and APS solutions from standard concentrations to the desired concentrations. For the samples to go into the gel, another group working in the same laboratory prepared the Laemmli Sample Buffer according to the package directions. 1X running buffer was used in the electrophoresis tank, which we diluted from 10X standard running buffer. The standard used contained the following known proteins: Myosin (200kDa), β-Galactosidase (116kDa), Phosphorylase b (97.4kDa), Serum Albumin (66.2kDa), Ovalbumin (45kDa), Carbonic Anhydrase (31kDa), Trypsin Inhibitor (21.5kDa), Lysozyme (14.4kDa), and Aprotinin (6.5kDa). We used 15μL of sample for running the gel, and 5μL of standard, both with Laemmli sample buffer added.
DATA and CALCULATIONS:
|
BSA (mg/mL) |
Absorbance |
|
0.2 |
0.823 |
|
0.35 |
1.104 |
|
0.55 |
1.251 |
|
0.75 |
1.493 |
|
0.9 |
1.613 |
|
UNKNOWN E |
0.830 |
Table 2. Raw data obtained from Spectrovis Spectrometer.
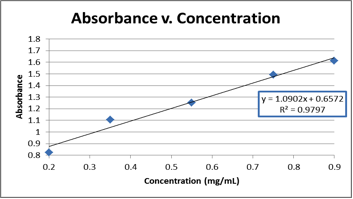
Graph 1. The graphical representation of the raw data from Table 2, which was used to find the equation needed to calculate the concentration of the unknown (E).
Calculation of the Concentration of the unknown protein sample E.
y=1.0902x + 0.6572
0.830=1.0902x + 0.6572
x=0.159mg/mL, BUT we did a 10X dilution, so the unknown protein sample (E) had a concentration of 1.59mg/mL
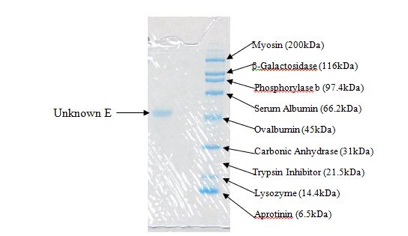
Figure 3. This is the portion of the gel containing our unknown protein (left) and the standard mixture (right).
RESULTS and DISCUSSION:
The concentration of unknown E was found to be 1.59 mg/mL. This was calculated by using absorbance spectroscopy to measure the absorbance of the unknown and then using an absorbance vs. concentration curve (made using known concentrations of BSA) to form an equation to find the concentration of the unknown. The equation derived from this graph is subject to some error. As shown on Graph 1, the R2 value (referring to the linearity of the best fit line for the data) was 0.9797, meaning that the line had about 2-3% deviation across the entire data set. This could translate into error in the equation of the line and subsequent calculations using that equation. In the future, additional trials would help improve the R2 value, and could yield a better equation and a more accurate calculated result.
The molecular weight of our unknown protein (E) is approximately 50kDa (50,000 g/mol). This is only an approximation based on the gel obtained experimentally and shown in Figure 3. As you can tell from the figure, the unknown falls just slightly above Ovalbumin at 45kDa but below Serum Albumin at 66.2kDa. This is why the estimated molecular weight is 50kDa. This molecular weight may only account for the weight of a subunit. In order to tell if we had a larger molecule with no subunits connected by a disulfide bond (or by multiple disulfide bonds), we should have performed the experiment without β-mercaptoethanol. This would alloe disulfide bonds to remain intact and if there was only a single line at 50kDa, we could conclude that the molecular weight of the unknown was 50kDa instead of possibly a combination of subunits which would yield a single line at 100, 150, or 200 kDa (anything above that molecular weight would have required different testing because it is outside of the scope of the SDS-PAGE). However, if this molecular weight does account for the weight of a subunit, then it can be concluded that all of the subunits are equivalent in molecular weight because only one line was visible with β-mercaptoethanol present.
CONCLUSIONS:
In this experiment, an unknown protein (E) was analyzed. It was found to weigh approximately 50kDa (50,000 g/mol) and it had a concentration of 1.56 mg/mL. By themselves, these traits are not sufficient for identification of the protein. However, in conjunction with other techniques, these bits of information can be very useful for structural information and could help with biological function analysis (for example, if the sample was taken from a living specimen, then the concentration of a given protein taken from a given part of the body may give clues as to the processes occurring in that part of the body).
ACKNOWLEDGMENT: I thank Prof. ****** for the use of the equipment and for guidance on experimental procedure as well as additional consultation and support.
REFERENCES:
1. Garrett, R. H.; Grisham, C. Biochemistry; Brooks/Cole, Cengage Learning: Canada, 2013, 2009; pp. 88-89.
2. Boyer, R. F.; Biochemistry Laboratory; Pearson Education: New Jersey, 2012, 2006; pp. 69, 166-175.
3. Bio-Rad Home Page. http://www.bio-rad.com (accessed Mar 27, 2013).
