TLC Assessment of the pH-dependent Separation of a Mixture
Written by Robert
Objective
The purpose of this experiment was to analyze the purity of the benzoic acid, p-nitroaniline, and anthracene that were separated by pH-dependent extraction in the previous lab. Purity tests were done using Thin Layer Chromatogrphy (TLC) on a silica gel substrate. TLC is a technique used for separating a mixture of compounds. This is done by first dissolving the compound (assumed to be initially solid) in a solvent such as dichloromethane, and then using a Pasteur pipet or drawn capillary tube, draw up some of the solution and place a small dot of it on the substrate. This spot should be placed approximately 1/5th up from the bottom of the plate, or at least above the height of the solution you will be using to develop the plate. One should make sure that the spot is not too large, since a larger spot may make it harder to see the layers separate after running the plate. Various developing solvents can be used to develop the plate; however it may take several different solvents to determine which is best for optimal separation. The function of the developing solvent is to “pull” the any compounds being separated up through the TLC plate by capillary action. That is, the polarity of the solvent will determine how far each component in the mixture moves. If a polar solvent were used, then the more polar components in the mixture would move closer to the solvent front (the height of the solvent moving up the plate), and the more nonpolar components would be down closer to where the initial spot was, having little movement. This is because the more polar components will “stick” to the solvent more than the nonpolar components and will therefore move faster with the solvent. The reason that multiple solvents should be tested is because each will differ in polarity, and will therefore have differing separation effects. The goal of TLC is to be able to separate the various components in a way that makes them distinguishable from each other, without being too close to the starting spot or solvent front. The TLC plate can then be placed under a UV lamp after it has been developed, and the various components of the mixture can be seen. Typically, one band means that the compound is pure, and two or more bands indicate some kind of impurity in the sample.
In this experiment, the three compounds in question were analyzed using toluene, dichloromethane, ethyl acetate, or some mixture of these compounds, as the developing solvent. The completed TLC plates were then analyzed under a UV lamp to determine the purity of the compound in question.
Data
For this experiment, various developing solvents were tested in order to find the one most effective for separating the three components. The first solvent tested was toluene. Toluene is relatively nonpolar, and was expected to be the worst of the three solvents tested due to the high polarity of benzoic acid. This turned out to be true when the plate was viewed and it was seen that while one spot moved fairly far up the plate, two other spots lingered around the starting point, barely moving at all. This led to the conclusion that toluene was much too nonpolar to use as a developing solvent. The next solvent tested was methylene chloride (DCM). This was the go-between of the three solvents, being more polar than toluene, but less polar than ethyl acetate. After viewing the developed plate, decent separation of the three components was seen, however, there was little movement for one of the spots towards the start of the plate. This was then presumed to be benzoic acid, since neither of the two less polar solvents were able to move that one spot. The third solvent, ethyl acetate, was then used to develop a third TLC plate. The result was all three of the spots being moved towards the top of the plate, due to the high polarity of the solvent. However, the spots were too close to each other, meaning that the separation was insufficient. Before mixing solvents, plate was developed to test both the 1:1:1 mixtures and the anthracene standard in toluene. This was due to the fact that the initial toluene plate showed good separation for one spot, which moved the most and was assumed to be anthracene based on polarity. The developed plate showed that this spot was indeed anthracene, however the solvent appeared to have smeared the spot across the top of the plate, making it difficult to read and analyze. This plate and solvent was decided to be a poor choice for developing future TLC plates.
Based on these results, it was decided that a mixture of different solvents would give the best separation, so as to slightly lower or raise the polarities of certain solvents. A TLC plate using a 4:1 mixture of DCM:ethyl acetate was developed, and the resulting plate showed very good separation, having just enough added polarity from the ethyl acetate to move the benzoic acid from the bottom of the plate. Just to make sure that all the combinations were tested, a 4:1 mixture of ethyl acetate:DCM was used to develop another plate, however the resulting plate did not have the solvent move the anthracene portion far enough up the plate, due to its differing polarity. It was then concluded that the solvent containing the 4:1 mixture of DCM:ethyl acetate was the best choice for optimum separation. From there, 3 separate plates were run using this solvent mixture. The first plate contained the anthracene standard, as well as the experimentally-obtained anthracene to be tested. The experimental compound for each plate was spotted twice; once at standard concentration, and a second time at a higher concentration, in order to try and spot impurities in the developed plate. The resulting plate was labeled with 2 spots, with spot 1 being the experimental compound, and the other being the standard. The experimental anthracene almost matched the standard spot perfectly, with the difference that the standard spot seemed to branch out towards the top, which may have been due to the solvent wick touching the TLC plate toward the top (will be discussed in the error section). The second plate was done for p-nitroaniline, using the same procedure as the anthracene plate. This plate yielded 3 different spots, with the standard being spot 1, the experimental spot lining up with the standard spot being spot 2, and a third spot above the other spots, being presumably an anthracene impurity, being spot 3. A third and final plate was run for benzoic acid, same as the other two plates. The result from this plate was two different spots, with spot 1 being the experimental benzoic acid, and spot 2 being the standard. The data for these three plates, as well as Rf values are summarized in Table 1 Table 2, with each subscript relating to each spot outlined above.

Table 1. Table containing experimental data from each TLC plate.

Table 2. Table containing calculated values for the resolution of each spot.
Calculations
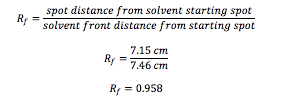
The only calculation for this experiment was for resolution (Rf). A sample calculation for spot 1 for anthracene is given below:
Results and Conclusions
This experiment showed that, using TLC, the experimental anthracene and benzoic acid samples were pure from the previous experiment. The only impurity seen was that of p-nitroaniline, which saw a band characteristic of what was seen for anthracene in it. This impurity may have been due to a small solubility of anthracene in water, which was then extracted along with the p-nitroaniline compound. Although it may be small, the sample taken from the collected compound may have had a trace amount of anthracene, which then showed up on the TLC plate. In response to the main question asked by the experiment outline, this process could be quantitative with the assistance of an NMR spectrometer and Mass Spectrometer. Once a plate was developed and analyzed, the portion containing each separated component could be scraped off of the plate and removed. This could be place on a funnel, such as a Buchner funnel or fritted funnel, and pulled by vacuum through along with a solvent of some sort. He collected filtrate could be analyzed first by NMR, due to its nondestructive nature, and then by Mass spectrometry. These results could be used to compare the spots to an analysis of the unseparated sample, and the amount of contaminant in the “pure compound” could be determined by the relative heights of the masses in the mass spectrometer readout.
While calculating the Rf values, it occurred that possibly it would have been a wise choice to also run a mixed solvent containing toluene. This error was thought of because of the high resolution values calculated for anthracene. Although the DCM:ethyl acetate mixture did a good job to separate the components well, a less polar solvent may have been more desirable when testing anthracene alone, and throwing out the solvent altogether could have been a mistake. Another source of error may have been the uniformity of the spotting of the plates. If each plate was not spotted in the same manner (too much or too little sample) as the others, streaking of components (which was seen in some plates) may have occurred. This can be regulated by spotting each plate the same number of times; however it is impossible to have the exact amount of sample for each plate.
Another source of error could have been from the way that the solvent wick was set up in the developing chamber (beaker). The wick is meant to keep the solvent vapors concentrated in the chamber, however since the chamber used was a simple beaker, careful measures had to be taken to ensure that the wick did not touch the TLC plate, since some of the solvent in the wick has the potential to leak onto the plate and disrupt the movement of the solvent front. This may have happened I nthe anthracene plate, seen in the way that the standard spot seemed to broaden towards the top of the plate, where it was most likely to be touching the wick. An easy way to fix this would have been to use a larger beaker which would have had a higher chance of spacing out the wick more evenly.
