Determination of lac Operon Functionality of Two Strains of E. coli by Comparing β-galactosidase Activity
By Christopher Cronkite:
Abstract
Operons are regions of prokaryotic DNA that contain multiple genes without an interfering termination sequence. Because of this, the genes in an operon are all transcribed into a single mRNA. In this way, a cell can regulate transcription of multiple, related genes using the same mechanisms. In Escherichia coli, the lac operon codes for three proteins involved in lactose catabolism. Expression of this operon is regulated by both a repressor and enhancer that function dependent on intracellular lactose and glucose levels respectively. A functional lac operon will be optimally expressed under conditions of high lactose and low glucose. In order to determine if a strain of E. coli contains a functional lac operon, a β-galactosidase assay can be employed. This assay measures the enzymatic activity of one of the proteins coded for by the lac operon, β-galactosidase, by spectrophotometrically detecting the presence of ONP, a product of the hydrolysis of ONPG catalyzed by β-galactosidase. Expression of the lac operon of cells grown in various lactose, glucose and IPTG concentrations is directly proportional to both the amount of β-galactosidase present in the cells and its enzymatic activity. By comparing β-galactosidase activity in two strains of E. coli grown under various conditions, it was able to be determined which strain contained a functional lac operon.
1. Introduction
Eukaryotes and prokaryotes differ in many aspects of cellular processes and anatomy, but a major difference resides in gene expression. Structurally, prokaryotes do not have a membrane-bound nucleus as eukaryotic cells do but instead contain a nucleoid, a mass of DNA existing as a single loop in the cytoplasm. [1] There are also differences between eukaryotes and prokaryotes in terms of transcriptional regulation. While eukaryotic cells rely on transcription factors and cofactors to regulate gene expression, prokaryotes utilize repressors and enhancers to control transcriptional levels. [2, 3] A very well-studied component of prokaryotic transcription regulation is the operon, a region of DNA that codes for multiple, related genes on a single mRNA and thereby is regulated by a single promoter and operator. [4]
The lac operon in Escherichia coli codes for three genes that are necessary to hydrolyze the β-D-galactoside lactose into glucose and galactose, thereby enabling glycolysis and energy procurement in the absence of glucose. [5, 6] The genes of the lac operon, lacZ, lacy, and lacA all code for a different enzyme utilized in lactose catabolism. [5, 7] lacZ codes for β-galactosidase, the enzyme responsible for lactose hydrolysis; lacY codes for β-galactoside permease, a cellular membrane transport protein that enables the cell to acquire more lactose; and lacA codes for β-galactoside transacetylase, an enzyme responsible for transferring an acetyl moiety from acetyl-CoA to lactose and other β-D-galactosides. [7] Each of these genes code for a protein involved in lactose catabolism, and while only lacZ and lacA are necessary for this process, β-galactoside permease enables the cell to uptake more available lactose and thus utilize the lactose catabolic pathway more efficiently. [8]
The lac operon is regulated by repressors and enhancers. [2, 9] A gene upstream of the lac operon, lacI, codes for a repressor that binds as a tetramer to the operator in order to prevent binding of RNA polymerase to the promoter. [7] While the repressor is bound, transcription of the lac operon will not occur. However, some lactose in cells is converted to allolactose that will bind to the repressor, causing it to separate from the operator by changing its conformation. [9,10] This opens the promoter to binding of RNA polymerase and transcription of operon. A sulfur analog of allolactose, isopropyl- β-D-thiogalactopyranoside (IPTG), will also repress the lac repressor, but unlike lactose, it is not hydrolyzed by β-galactosidase. Because of this, IPTG will remain in the cell and allow continued transcription of the lac operon. [11]
The lac operon also contains a method for enhancement of transcription. Low glucose levels in E. coli result in fold increases of cyclic AMP (cAMP) concentrations in the cell, and vice versa. [12] An enhancer known as CAP (catabolite activator protein; sometimes referred to as CRP, the cAMP receptor protein) binds to the DNA near promoters in the presence of cAMP. [12, 13] The binding of CAP enhances RNA polymerase’s binding to the promoter and thus encourages operon expression.
These regulatory mechanisms for the lac operon are important in order to conserve cellular energy and express the lac operon only when necessary. [2] Because glycolytic enzymes are constitutive genes and are consequently continuously expressed, expression of the lac operon would be useless under high glucose conditions. Additionally, since it is more efficient to catabolize glucose than it is to hydrolyze lactose and then subject the products to glycolysis, cells under conditions of high glucose and high lactose need not to express the lac operon. [4, 14] Only in the absence of glucose and the prevalence of lactose in a cell is it beneficial to initiate transcription and translation of the lac operon. Otherwise, low intracellular levels of lactose will promote binding of the lac repressor to the operator, thereby inhibiting expression of the operon, and high glucose levels in a cell will decrease intracellular cAMP levels, thereby preventing binding of CAP and transcriptional enhancement.
A functional lac operon in important for E. coli cells to optimize energy usage. [2] Some strains of E. coli may possess a knockout that destroys lac operon functionality. A β –galactosidase assay can help determine whether or not a certain strain of E. coli contains a fully functional lac operon. [15] This assay measures the enzymatic activity of β-galactosidase by monitoring the hydrolysis of o-nitrophenyl- β-D-galactopyranoside (ONPG) into o-nitrophyenyl (ONP) and galactose. ONP is yellow in color and can be detected at A420 using a spectrophotometer. [16, 17] Since the production of ONP, the activity of β-galactosidase, the quantity of β-galactosidase present, and the degree of expression of the lac operon are all directly proportional to each other, it is possible to compare lac operon expression under various conditions. E. coli strains will functional lac operons will have the highest β-galactosidase activity when grown with low levels of glucose and high levels of lactose, and even more so with IPTG, due to repression of the lac repressor and binding of CAP. [18] Under high glucose conditions, there will be very little expression of the lac operon due to lack of binding of CAP; even with the presence of lactose to remove the repressor, the degree of expression will not be as great as with high lactose, low glucose levels. In this way, it was determined which of two strains of E. coli contained a functional lac operon.
2. Materials and Methods
2.1. Preparation of Bacterial Cultures
5 mL of the two strains of E. coli (Strain 1 and Strain 2) were grown overnight in LB. The cultures were then diluted into five separate flasks, each containing 50 mL LB, and were left to grow to A600 around 0.01 to 0.02. Glucose was added to one culture to a concentration of 5 mg/mL, lactose to another at 5 mg/mL, glucose and lactose together to 5 mg/mL each, and IPTG to a fourth to 0.1 mM. Each culture was grown to A600 between 0.05 and 0.1. The cultures were stored on ice.
2.2. β-galactosidase Assay
Assays were performed in duplicate. Cell densities of the five cultures were measured using A600 readings. 1.0 mL samples from each condition were centrifuged, following which the supernatant was discarded. The pellet was resuspended in 1 mL Z-buffer, to which was added 60 μL chloroform and 40 μL 0.1% SDS. Samples were vortexed and left to ambient temperature for ten minutes. 150 μL of 4 mg/mL ONPG solution was introduced to each sample and immediately vortexed. The time was recorded between introduction of the ONPG solution and visualization of the solution’s yellowing. At this point, 0.375 mL 1M Na2CO3 was added to the samples and immediately vortexed. The samples were centrifuged, and the supernatant was measured at A420.
3. Results
Measurements at A600 were recorded prior to cell lysis, and A420 measurements were taken immediately following change of the samples’ color. Miller Units were calculated for each condition so as to normalize for total protein concentration and velocity of the reaction using the following equation:, where A420 and A600 are the respective absorbencies at the designated wavelength, time is the length of time the reaction took place for in minutes, and volume is 1.0 mL, the size of the samples. Student’s t-test was applied to determine whether the conditions were statistically significant compared to the control for each strain; values of less than 0.05 are considered statistically significant. All values are recorded in tables 1 and 2.
Since none of the samples from Strain 1 turned yellow within ten minutes of ONPG introduction, the reaction was stopped and absorbencies were taken. The Miller Units for the various conditions with Strain 1 were very similar, and all of the t-test values were greater than 0.05 when compared with the control.
The reaction times of the samples from Strain 2 varied depending on the conditions. The shortest reaction time occurred with the culture grown with IPTG, the solution yellowing before two minutes had passed. The sample with lactose introduced into it turned yellow before three minutes, and the control visibly changed color shortly after seven and a half minutes had passed. The Miller Units of the various Strain 2 conditions differed greatly with a 1000-fold increase between the control and IPTG solutions and a 200-fold increase between the control and lactose solutions. The t-test values for each of these conditions were less than 0.05 when compared with the control.
Table 1
| Strain1 |
A600 |
Time (min) |
A420 |
Miller Units |
| Control |
0.23 |
10.00 |
0.004 |
1.73 |
| Control |
0.23 |
10.00 |
0.014 |
6.06 |
| G&L |
0.22 |
10.00 |
0.005 |
2.24 |
| G&L |
0.22 |
10.00 |
0.012 |
5.38 |
| Lactose |
0.26 |
10.00 |
0.010 |
3.92 |
| Lactose |
0.26 |
10.00 |
0.009 |
3.53 |
| Glucose |
0.14 |
10.00 |
0.008 |
5.84 |
| Glucose |
0.14 |
10.00 |
0.019 |
13.9 |
| IPTG |
0.25 |
10.00 |
0.013 |
5.24 |
| IPTG |
0.25 |
10.00 |
0.005 |
2.02 |
| Strain2 |
A600 |
Time (min) |
A420 |
Miller Units |
| Control |
0.29 |
7.37 |
0.006 |
2.79 |
| Control |
0.29 |
7.40 |
0.013 |
6.02 |
| G&L |
0.27 |
10.00 |
0.10 |
37.4 |
| G&L |
0.27 |
10.00 |
0.13 |
48.0 |
| Lactose |
0.29 |
2.75 |
0.70 |
884 |
| Lactose |
0.29 |
2.93 |
0.74 |
877 |
| Glucose |
0.12 |
10.00 |
0.02 |
17.0 |
| Glucose |
0.12 |
10.00 |
0.02 |
19.5 |
| IPTG |
0.29 |
1.67 |
2.35 |
4910 |
| IPTG |
0.29 |
1.98 |
2.37 |
4160 |
A comparison between A600 and A420 values, reaction time lengths, and Miller Units for each of the conditions of Strain 1 and Strain 2 performed in duplicate.
Table 2
| Strain 1 | Miller Units Mean | Standard Deviation of Miller Units | T-Test Value |
| Control |
3.9 |
3.06 |
— |
| G&L |
3.81 |
2.22 |
0.978 |
| Lactose |
3.73 |
0.277 |
0.945 |
| Glucose |
9.85 |
5.68 |
0.321 |
| IPTG |
3.63 |
2.28 |
0.93 |
| Strain 2 | Miller Units Mean | Standard Deviation of Miller Units | T-Test Value |
| Control |
4.4 |
2.28 |
— |
| G&L |
42.7 |
7.51 |
0.0204 |
| Lactose |
880 |
4.63 |
0.0000174 |
| Glucose |
18.2 |
1.8 |
0.0214 |
| IPTG |
4540 |
529 |
0.00674 |
The mean of the duplicate Miller Units was used to determine the standard deviation for each of the growth conditions for both strains. T-test values were calculated using the Miller units of the control group against each of the other groups’ values. The t-test values of Strain 1 were all greater than 0.05, whereas the values for Strain 2 were all less than 0.05.
4. Discussion
The bacterial lac operon codes for three separate proteins required for lactose catabolism. This polycistronic gene is fully expressed only under both low glucose and high lactose levels in the cell. The lacZ gene of the operon codes for β-galactosidase, a protein that hydrolyzes β-D-galactosides. Because of β-galactosidase’s enzymatic activity, it is possible to determine whether or not a bacterial strain contains a functional lac operon by growing cultures of the strain in environments with differing concentrations of glucose, lactose, and IPTG and conducting a β-galactosidase assay. Since the enzymatic activity of β-galactosidase will be directly proportional to both the amount of enzyme present in the solution and the degree of expression of the lac operon, comparing β-galactosidase activity of the cells grown under these various conditions will provide insight as to a strain’s lac operon functionality. The strain with high β-galactosidase expression under both high lactose, low glucose and IPTG conditions and low expression under high glucose conditions would contain functional lac operons as both the repression and enhancement mechanisms would be operating.
The change in expression of β-galactosidase for each of the conditions of Strain 1 was negligible. Every condition except for the high glucose concentration yielded results within 0.3 Miller Units of the control group. Despite the addition of lactose or IPTG to the cultures as they were growing, the cells of Strain 1 did not express higher levels of β-galactosidase in response providing evidence for a faulty repression mechanism. While there is a low level of activity of β-galactosidase in each condition, the amount of activity does not significantly change from one condition to the next as it should with a functional lac operon. Though the Miller Units for the high glucose condition is nearly three-fold that of the others, the statistical significance of this difference is negligible. In addition, when compared to the β –galacotsidase activity of the lactose and IPTG conditions of Strain 2, it was seen that lac operon expression was negligible (fig. 1). Due to the lack of a change in activity of β-galactosidase and therefore expression under the various growth conditions, it can be concluded that Strain 1 cells do not contain functional lac operons.
It is immediately apparent that Strain 2 contains a functional lac operon. The Miller Units calculated for the control group and the sample grown in high glucose, both of which should be lowest, were less than 20, inferring low β-galactosidase expression. This provides evidence that repression of the lac operon occurred. Comparatively, there was an exponential increase of ONP production in the sample from the cells grown under high lactose conditions, as shown by the Miller Unit calculation of 880, proving activation of the operon. The lysate from the cells grown with IPTG exhibited even greater β-galactosidase activity with a more than 1000-fold increase in activity compared to the control group. This activity is higher than that of the high lactose group because IPTG is not hydrolyzed by β-galactosidase as lactose is, meaning that repression of the lac repressor is continuous. Moreover, the lysate from the cells grown with both glucose and lactose supplements exhibited a 10-fold increase in β-galactosidase activity and therefore lac
Figure 1
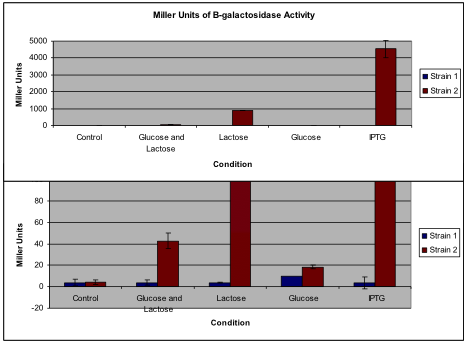
A comparison of the average Miller Units calculated for both strains under each of the conditions. Standard deviations are shown for each condition, though some are not visible due to their small value. The top figure displays the quantity of Miller Units to scale with Strain 2 grown with IPTG. However, since not all of the conditions are visible on this scale, the bottom graph peaks at 100 Miller Units to allow visualization of the smaller quantities. Note that the bars for Strain 2 under lactose and IPTG conditions exceed the limits of the lower graph. Calculations of the Miller Units for Strain 1 revealed consistently low numbers, whereas calculations for Strain 2 varied greatly depending on the condition.
operon expression due to the high lactose levels. Expression of the operon was made available by the presence of lactose repressing the lac repressor, but because of the high glucose levels, expression was not enhanced. However, this does further support the conclusion that Strain 2 contains a functional lac operon with both its repression and enhancement mechanisms working correctly. Because of the relative β-galactosidase activities of the lysates from cells grown under the various conditions, Strain 2 is concluded to contain a functional lac operon.
While this experiment tested four different growth conditions, it is not necessary to utilize the IPTG condition to test for a lac operon’s functionality. Because IPTG is an analog to allolactose that is not hydrolyzed by β-galactosidase, measuring the enzyme’s activity in cells grown with IPTG allows insight into the total capacity for lac operon expression. Since IPTG is not easily broken down by the cell, the degree of expression of the lac operon will remain high; with only lactose, the β-galactosidase will hydrolyze the carbohydrate, reducing the amount of lactose present in the cell, thereby reducing expression of the operon. All that is necessary in order to determine the functionality of a lac operon is to address repression and activation of the operon using differing lactose and glucose concentrations during cell culture growth.
Future experiments performed in a similar way can answer the question of how inducible a functional lac operon is under various glucose, lactose, and IPTG conditions. By manipulating the concentrations of the supplements and calculating Miller Units for β-galactosidase activity, optimal conditions for lac operon expression can be determined. It is also possible to add high concentrations of cAMP to the conditions to determine if greater enhancement of expression can occur. Since LB contains glucose and thereby will limit cAMP levels in the cell, increasing the concentration of cAMP may increase expression of the operon. Nevertheless, it has been shown through this experiment that Strain 2 contains a functional lac operon than can be induced to express under high lactose and IPTG conditions.
Works Cited
1. Thanbichler, M., et al., The bacterial nucleoid: a highly organized and dynamic structure. J Cell Biochem, 2005. 96(3): p. 506-21.
2. Bolivar, F., et al., The three operators of the lac operon cooperate in repression. Gene, 1977. 2(2): p. 75-93.
3. Jacob, F. and J. Monod, Genetic regulatory mechanisms in the synthesis of proteins. J Mol Biol, 1961. 3: p. 318-56.
4. Eron, L. and R. Block, Mechanism of initiation and repression of in vitro transcription of the lac operon of Escherichia coli. Proc Natl Acad Sci U S A, 1971. 68(8): p. 1828-32.
5. Stent, Gunther S., The operon: on its third anniversary. Science, 1964. 144(3620): p. 816-20.
6. Dickson, R.C., et al., Genetic regulation: the Lac control region. Science, 1975. 187(4171): p. 27-35.
7. Lewis, Mitchell, et al., Crystal structure of the lactose operon repressor with DNA and inducer. Science, 1996. 271(5253): p. 1247-54.
8. Jobe, A. and S. Bourgeois, lac Repressor-operator interaction. VI. The natural inducer of the lac operon. J Mol Biol, 1972. 69(3): p. 397-408.
9. Ohshima, Y., T. Mizokoshi, and T. Horiuchi, Binding of an inducer to the lac repressor. J Mol Biol, 1974. 89(1): p. 127-36.
10. Higgins, C. F., et al., A novel intercistronic regulatory element of prokaryotic operons. Nature, 1982. 298: p. 760-2.
11. Casadaban, M.J. and S.N. Cohen, Structure of the lac operon galactoside acetyltransferase. Structure, 2002. 10(4): p. 581-8.
12. Castilho, B.A., P. Olfson, and M.J. Casadaban, The relationship between external glucose concentration and cAMP levels inside Escherichia coli: implications for models of phosphotransferase-mediated regulation of adenylate cyclase.. Microbiology, 1997. 143(6): p. 1909-18.
13. Hansen, L.H., S. Knudsen, and S.J. Sorensen, The effect of the lacY gene on the induction of IPTG inducible promoters, studied in Escherichia coli and Pseudomonas fluorescens. Curr Microbiol, 1998. 36(6): p. 341-7.
14. Marbach, A. and K. Bettenbrock, lac operon induction in Escherichia coli: Systematic comparison of IPTG and TMG induction and influence of the transacetylase LacA. J Biotechnol, 2012. 157(1): p. 82-8.
15. Mueller-Hill, B., H.V. Rickenberg, and K. Wallenfels, Specificity of the Induction of the Enzymes of the Lac Operon in Escherichia Coli. J Mol Biol, 1964. 10: p. 303-18.
16. Lewendon, A., et al.. Structural and mechanistic studies of galactoside acetyltransferase,
the Escherichia coli LacA gene product. J Biol Chem, 1995, 270(44): 26326-31.
17. Jain, V. K. and I. T. Magrath. A chemiluminescent assay for quantitation of beta-
galactosidase in the femtogram range: application to quantitation of beta-galactosidase
in lacZ-transfected cells. Anal Biochem, 1991 199(1): 119-24.
18. Griffith, K. L. and R. E. Wolf, Jr. Measuring beta-galactosidase activity in bacteria: cell
growth, permeabilization, and enzyme assays in 96-well arrays. Biochem Biophys Res
Commun, 2002, 290(1): 397-402.[1]
