Activity Coefficients Experiment
Activity Coefficients Experiment
By: Stephen Fry
Introduction
While pH is often treated as the negative logarithm of the concentration of protons or hydronium ions, p[H], it is defined as the negative logarithm of the activity of hydrogen ions in a solution:
pH = -log(aH+) = -log(cH+ ×γH+)
Where c is the molal concentration and γ is the activity coefficient. However, the activity a single ion in solution cannot be measured due to the necessity of a counter ion. To overcome this precise measurements of pH are done using a standard method in which a hydrogen electrode and a silver chloride or mercury(I) chloride reference electrode are immersed in the same aqueous solution and the electromotive force measured. Such cells using silver-silver chloride electrodes are commonly known as Harned Cells which when measuring the pH of a hydrochloric acid solution is schematically represented as:
Pt|H2(g)|HCl(aq)|AgCl(s)|Ag(s)
The half reactions at each electrode are:
anode: H2 ↔ 2H+ + 2e–
and
cathode: 2AgCl + 2e– ↔ 2Cl–
Applying the Nerst equation to these two reactions and simplifying using aH2 = 1, = 0, and aAgCl = 0 yields:
EHE = -RT*F-1ln((pH2)1/2(aH+)-1) (1)
and
EAg/AgCl= – RT*F-1ln aClˉ (2)
Where pH2 is the partial pressure of hydrogen at the electrode. The potential of the cell is given by:
Ecell = EAg/Cl – EHE = + RT*F-1ln((pH2)1/2(aH+aClˉ)-1) (3)
Since the concentrations of Cl– and H+ are essentially equal the product of the activities can be expressed as:
aH+aClˉ = γH+cH+γClˉcClˉ = γ±2c2 (4)
Where γ± is the mean activity coefficient. When combined with equation 3 this gives:
Ecell = + RTF-1ln(γ± -2) + RTF-1ln((pH2)1/2c-2) (5)
. When √I, which is equivalent to √c in a 1:1 electrolyte, is sufficiently small the Debye-Huckel equation can be simplified:
ln γ± =-A√I(1+Ba√I)-1 ≈ -A√I = -A√c (6)
And equation 5 can be simplified to:
Ecell – RTF-1ln((pH2)1/2c-2)= + 2ARTF-1√c =
Therefore can be determined as the y-intercept and A as the slope multiplied by F(2RT)-1 of the plot of vs.√c.
Data
Solutions of HCl were prepared from a 2.755 M stock solution. The molality of these solutions was calculated from the molarity using the equation:
M/c = a – bc (7)
where M is the molarity and a and b are temperature dependent constants with values of 0.9982 and 0.01805, respectively, at 20 oC1.
Table 1. Concentration and Cell Potential
| Molarity (mol L-1) | Molality (mol kg-1) | Cell Potential (V) |
| 0.008001 | 0.008016 | 0.46823 |
| 0.009995 | 0.01001 | 0.45637 |
| 0.01499 | 0.01502 | 0.43793 |
| 0.02000 | 0.02004 | 0.42418 |
| 0.03000 | 0.03007 | 0.40639 |
| 0.05000 | 0.05014 | 0.38089 |
| 0.09998 | 0.1003 | 0.34751 |
was calculated from equation 6 at each concentration and plotted against the square root of the molal concentration in Figure 1. The linear fit, calculated using the first third and fourth concentrations, the second was omitted for this purpose as it is an outlier, was used to find which was used to solve equation 5 for γ± at each concentration and the extended Debye-Huckel equation from Harned and Ehlers for the literature γ±.1
Table 2. Calculated Values
| (V) | Square Root of Molality, √c (mol-1/2 kg-1/2) | Mean Activity Coefficient, γ± | Literature Mean Activity Coefficient γ±H&E 1 | % Difference from lit. value |
| 0.224 | 0.08953 | 0.9024 |
0.911635 |
1.554649 |
| 0.224 | 0.1001 | 0.9134 |
0.902907 |
3.727701 |
| 0.226 | 0.1225 | 0.8774 |
0.885586 |
1.644177 |
| 0.227 | 0.1416 | 0.8630 |
0.871682 |
1.572616 |
| 0.229 | 0.1734 | 0.8180 |
0.850602 |
1.332532 |
| 0.230 | 0.2239 | 0.8127 |
0.820889 |
1.575773 |
| 0.231 | 0.3168 | 0.7863 |
0.776617 |
3.80971 |
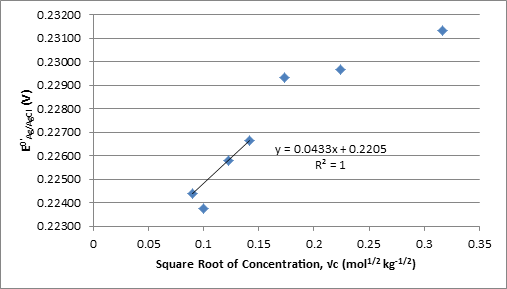
Figure 1. Plot of Against Square Root of Molality Used to Determine
The values of γ± were also plotted against the square root of the concentration; the linear regression through the origin has the form of the limiting equation with the slope equal to Azi2 where zi is the charge on each ion:
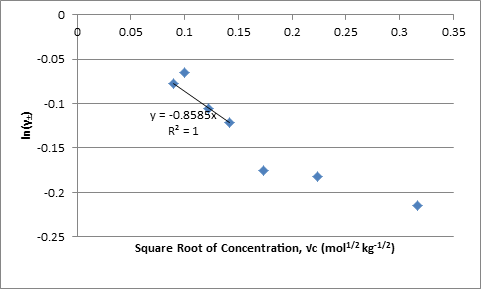
Figure 2. Plot of ln γ± Against Square Root of Molality
The value of A from the slope in Figure 1 times F(2RT)-1 and from the slope in Figure 2 are -0.8569 and -0.8585 kg-1/2 mol1/2 respectively.
Discussion
The experimental values for γ± in this experiment are fairly different from the Harned and Ehlers’ γ± calculated using the expanded Debye-Huckle equation. The most significant deviation occurs in the measurement for the 0.01 M solution. This value was not used when linear regressions were calculated in order to obtain values for with smaller uncertainty, R2 increases from .821 to .99997 with removal of 0.01M. Data points above 0.01M also deviate from the linear regressions, but this is expected as are linear with respect to √c only when 1+Ba√c ≈ 1.
Questions
- The literature mean activity coefficient in table2were calculated using Harned and Ehlers experimental and calculated values for the constants in the Gronwall, La Mer, and Sandved extention of the Debye-Huckle equation:
γ±H&E = 10^(uM1/2(1+K’a(2M)1/2)-1 + CGLS20 – log(1+0.036c) + BM + DM2
where K’ and a are experimentally determined constants CGLS20 is the total Gronwall, La Mer, and Sandved extension extrapolated to 20oC and for 0.008M and 0.03M solutions. Harned and Ehlers’ equation gives slightly lower mean activity coefficients at all concentrations, the extrapolation to 20oC was not perfect and the measurements in this experiment may have been taken slightly above 20oC. The largest difference occurred at those concentrations which have values that don’t match the linear relation to √c that the others do, for these two it seems likely there was error in preparation of the solution. For the remaining concentrations the percent difference between the two γ± was small and consistent, exemplifying the traceability of this method.
| u20 | K’20 | a (10-10 m) | CGLS20 (extrapolated to 20o C and 0.008 and 0.03 M) |
| 0.502 | 0.2317 | 4.3 | 0.00030 to 0.00080 |
- Using the simpler version of the Debye-Huckle equation with A=0.5085, B=0.3281, and a = 4.3:
-logγ = A√I(1+Ba√I)
Gives results differing by at most 0.4% from Harned and Ehlers results, so comparison to experimental values is the same.
4. Molal measurement has the advantage of being temperature and pressure independent. Molarity is more common and requires less calculation to prepare dilutions of, it is often more convenient to measure the volume of a solution than it’s mass.
Works Cited
Harned, H. S.; Ehlers, R. W. The Thermodynamics of Aqueous Hydrochloric Acid Solutions from Electromotive Force Measurements. J. Am. Chem. Soc. 1993, 55, 2179-2193.
