ANALYTICAL TECHNIQUES FOR THE COMPOSITION OF PETROLEUM ETHER FRACTIONS
ANALYTICAL TECHNIQUES FOR THE COMPOSITION OF PETROLEUM ETHER FRACTIONS
By: Mohammad Ali Salik
AIM:
The aim of this case study is to choose a suitable instrumental analytical method to investigate the composition of the different petroleum ether fractions. When choosing the analytical technique, a lot of factors need to be looked at such as cost, sensitivity (level of detection), resolution and availability of instrumentation.
INTRODUCTION:
Petroleum ethers are laboratory solvents which basically contain a mixture of alkanes – both branched and straight chain. It is a group of various volatile, highly flammable, liquid hydrocarbon mixtures used chiefly as nonpolar solvents. Petroleum ethers with various boiling point ranges (typically 40-60oC, 60-80oC, and 80-100oC) may be purchased with the range reflecting the composition of the mixture.
ANALYTICAL TECHNIQUES AVAILABLE:
There are a number of analytical techniques we can use for the investigation of the composition of different petroleum ether fractions including:
1. GAS CHROMATOGRAPHY (GC): It is used to separate volatile components of a mixture. A small amount of the sample to be analysed is drawn up into a syringe. The syringe needle is placed into a hot injector port of the gas chromatograph, and the sample is injected. The injector is set to a temperature higher than the components’ boiling points. So, components of the mixture evaporate into the gas phase inside the injector. A carrier gas, such as helium, flows through the injector and pushes the gaseous components of the sample onto the GC column. It is within the column that separation of the components takes place. Molecules partition between the carrier gas (the mobile phase) and the high boiling liquid (the stationary phase) within the GC column. After components of the mixture move through the GC column, they reach a detector. Ideally, components of the mixture will reach the detector at varying times due to differences in the partitioning between mobile and stationary phases. The detector sends a signal to the chart recorder, which results in a peak on the chart paper. The area of the peak is proportional to the number of molecules generating the signal.
2. HIGH-PERFORMANCE LIQUID CHROMATOGRAPHY (HPLC): In HPLC, the sample is dissolved in a suitable liquid and a small aliquot is injected into the flowing mobile phase and pumped through an HPLC column packed with small particles of a stationary phase. These stationary-phase particles have specific properties which depend on the type of HPLC which is being performed – reversed-phase (RP), normal-phase (NP), ion-exchange (IEX), size-exclusion (SEC), and hydrophobic (HIC) and hydrophilic (HILIC) interaction chromatography, among others. As the mixture of analytes passes over the stationary-phase particles, each of the components interacts with the particles in a slightly different way, depending on its specific physical and chemical properties, causing each component to separate into a discrete band which elutes from the column at a different time. These discrete bands are visualized by the detector as separate ‘peaks’ which elute at characteristic ‘retention times.’ Using software, these peaks are recorded and their properties can then be measured and related back to the amounts of the various components which were present in the original sample.
PREFERRED ANALYTICAL TECHNIQUE:
Gas chromatography (GC) is the preferred analytical technique due to the following reasons:
• GC is a widely used technique for the separation of volatile substances in gas phase and uses simple instrumentation and is rapid.
• Only instrument with the sensitivity to detect volatile organic mixtures of low concentrations.
• GC is very sensitive: the sensitivities of the detectors are in the range of 10-8 to 10-15 g of solute per second.
• GC requires a relatively smaller amount of sample for analysis.
• Results from a GC are rapidly obtained.
• GC is less expensive than HPLC to run as HPLC requires the use of highly expensive, highest grade of purity solvents, buffers and chemicals termed as HPLC grade.
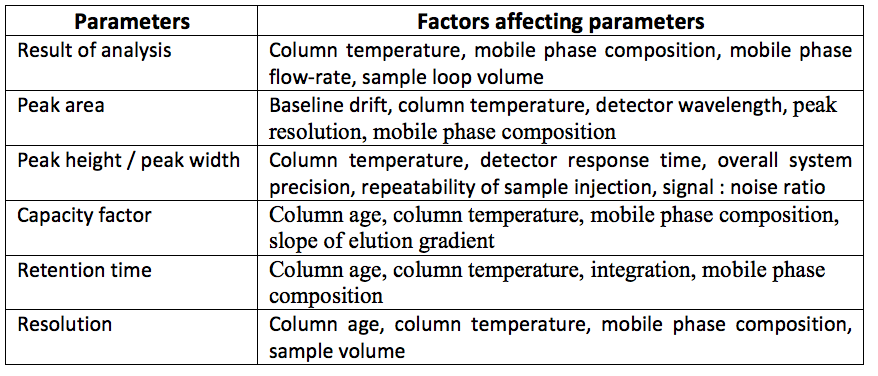
• HPLC is not the preferred technique. It has a sensitivity limit of 10-9 to 10-11 gm/ml. Also there are a lot of factors which affect the analysis by HPLC. Some of these factors are shown in the table below:
ANALYSIS:
• To examine a chemical by gas chromatography, it is necessary to place this chemical into a gaseous mobile phase so that the analyte can then enter and pass through the GC column. This requirement means that the injected analyte must be volatile, or able to go easily into the gas phase. The volatility of a chemical is related to its vapour pressure and boiling point. For instance, volatile chemicals like those that are classified as VOCs will have high vapour pressures and low boiling points. This property is what allows VOCs to enter the atmosphere and react with nitrogen oxides to form ozone. The same property also makes it easy for gas chromatography to separate and analyse such compounds. This is the reason GC is used for the investigation of the composition of different petroleum ether fractions.
• Quantitative Analysis: The area under a peak is proportional to the amount of analyte present in the chromatogram. By calculating the area of the peak using the mathematical function of integration, the concentration of an analyte in the original sample can be determined. Concentration can be calculated using a calibration curve created by finding the response for a series of concentrations of analyte, or by determining the relative response factor of an analyte. The relative response factor is the expected ratio of an analyte to an internal standard (or external standard) and is calculated by finding the response of a known amount of analyte and a constant amount of internal standard (a chemical added to the sample at a constant concentration, with a distinct retention time to the analyte).
• Qualitative Analysis: Generally chromatographic data is presented as a graph of detector response (y-axis) against retention time (x-axis), which is called a chromatogram. This provides a spectrum of peaks for a sample representing the analytes present in a sample eluting from the column at different times. Retention time can be used to identify analytes if the method conditions are constant. Also, the pattern of peaks will be constant for a sample under constant conditions and can identify complex mixtures of analytes. In most modern applications however the GC is connected to a mass spectrometer or similar detector that is capable of identifying the analytes represented by the peaks.
APPARATUS:
The block diagram of a GC is as follows:
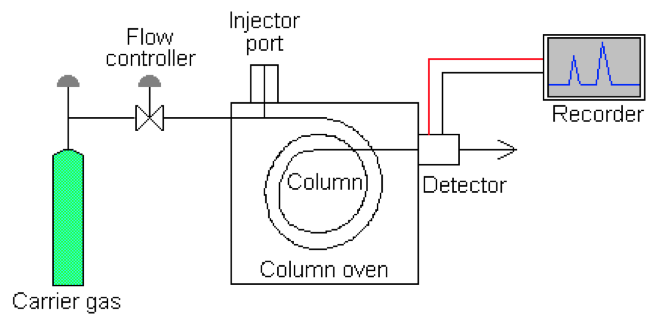
COMPONENTS:
• Carrier Gas: It is supplied from gas cylinder (3000psi when full) and has a two stage regulator to reduce supply pressure to instrument. There is a gas clean up if required (-H2O and O2). Carrier gas must be inert to all system and sample components. There are a few gases which can be used as a carrier gas including nitrogen (most commonly used in packed column systems), helium (expensive, but used in systems with thermal conductivity detectors) and hydrogen (danger of explosion).
• Flow Controller: There is a flow control in gas chromatograph. Gas flow can be controlled by two possible methods:
(a) Pressure regulator across a restriction to give a constant flow by setting a head pressure (flow changes with temperature).
(b) Mass flow controller (flow remains constant when temperature changes).
• Injectors: There can be two types of injectors –
(a) Standard Type: There is a heated zone where liquid samples are vapourised and septum (inert) made of silicone to allow micro syringe needle to get into system. An auto sampler can also be fitted.
(b) Gas Sampling Valve: This is mostly used nowadays. It is a simple method for injecting gases and consists of a 6 port valve. It has a variable size injection loop; it can be heated and automated.
• Column: It is made up of coiled glass or metal and has fittings to connect to the injector and detector. A column is inert to carrier gas and samples. Columns made up of glass are fragile and hence the ones made up of metals are used more and would be used for this analysis as well. There are two types of columns:
(a) Packed columns: these are 1.5 – 10 m in length and have an internal diameter of 2 – 4 mm. The tubing is usually made of stainless steel or glass and contains a packing of finely divided, inert, solid support material (e.g., diatomaceous earth) that is coated with a liquid or solid stationary phase. The nature of the coating material determines what type of materials will be most strongly adsorbed. Thus numerous columns are available that are designed to separate specific types of compounds.
(b) Capillary columns: these have a very small internal diameter, on the order of a few tenths of millimetres, and lengths between 25-60 meters are common. The inner column walls are coated with the active materials (WCOT columns); some columns are quasi solid filled with many parallel micropores (PLOT columns). Most capillary columns are made of fused-silica with a polyimide outer coating. These columns are flexible, so a very long column can be wound into a small coil.
• Detectors: The ideal detector for a GC needs to have the following properties: High sensitivity, universal response, wide linear dynamic range, fast response speed, stable, low background noise, reliable, easy to operate and reproducible. There are a number of detectors which can be used in a GC. They are: (a) Thermal conductivity: The response is based on the difference between thermal conductivity of analyte and carrier gas. It is linear and has a wide dynamic range. This detector may be used for petroleum ether fractions analysis. (b) Flame ionisation detector (FID): This is the most common GC detector. It responds to most organics and has a wide dynamic range. It needs hydrogen and air
. This may be used for petroleum ether fractions analysis. Other types of detectors are selective / specific detectors and include:
(c) Electron Capture Detectors (ECD),
(d) Thermionic Specific Detector (NPD),
(e) Flame Photometric Detector (FPD). A mass spectrometer can also be used with a GC, but this would be secondary analysis.
• Electronics: It consists of electrometers and amplifiers which are required to transform the raw detector signal to a usable signal for either chart recorder or analogue to digital converter. Recent advances have given detectors with digital output.
DISCUSSION:
There are a range of factors which could adversely affect GC analysis.
Controlling Separation:
Problem – some components of a mixture may have very high velocities and others extremely low velocities so it is necessary to slow down fast components so they can be separated & speed up slow components so analysis does not take forever.
Solutions – (a) Temperature Programming: each analyte is effectively eluted as it reaches its “boiling point”. It requires good control algorithm for oven temperature – microprocessors – reproducible temperature gradient from run to run. Temperature programming has a lot of advantages such as sharp peaks throughout run, narrow peaks throughout run, easily quantifiable peaks and through temperature programming we can analyse wide boiling range mixtures.
(b) Isothermal: Oven temperature is held constant along with constant flow. Another characteristic of isothermal is peak broadening.
(c) Controlling Flow Rate: Two methods are used – i) Pressure regulator across a restriction to give a constant flow by setting a head pressure (flow changes with temperature); ii) Mass flow controller (flow remains constant when temperature changes). iii) A soap bubble flow meter can also be used to measure the flow rate of the carrier gas.
Injection Volume & Temperature:
Problem – Slow injection of large samples causes band broadening and loss of resolution. Secondly, when injection port temperature is too low, heavier components such as a hydrocarbon with 22 carbon atoms, C22, would not gain enough energy to vaporize during the 1 minute splitless time.
Solution – For optimum column efficiency, the sample should not be too large, and should be introduced onto the column as a “plug” of vapour. The most common injection method is where a micro syringe is used to inject sample through a rubber septum into a flash vapouriser port at the head of the column. Secondly, the temperature of the sample port is usually about 50°C higher than the boiling point of the least volatile component of the sample.
CONCLUSION:
There are a number of analytical techniques we can use for the investigation of the composition of the different petroleum ether fractions, but Gas Chromatography (GC) is the preferred analytical technique due to its cost effectiveness, sensitivity, resolution and its applicability. Although there are a range of factors which could adversely affect GC analysis, all these factors can be overcome.
REFERENCES:
• Google images for block diagram of GC.
• Instrumental techniques: theory and practice book for description of components of GC.
• http://ochemlabtechniques.blogspot.co.uk/p/how-gas-chromatography-works.html – Introduction to GC
• http://www.analyticalventura.com/hplc.shtml – introduction to HPLC
http://www.cromlab.es/Articulos/Incertidumbre/Sources%20of%20Uncertainty%20in%20GC%20and%20HPLC.%20Review.pdf – for factors affecting parameters of HPLC
