Calibrating Flow Meters and Exploring Reynolds Number Report
Introduction:
Lab group three was asked to calibrate the rotameter and orifice meter. It was also requested of us to measure the range of Reynolds numbers able to be read in the CM3215 laboratory.
The orifice meter is a section of pipe with a restriction that acts to create a pressure drop. As the fluid approaches the orifice, the pressure increases and then suddenly drops as a result of the velocity increase through the reduced cross sectional area. A rotameter measures the flow rate of a liquid or gas. It is generally a tapered tube with a float that is pushed up by the drag force of the flow and pulled down by gravity. One highly beneficial quality of a rotameter is that it requires no outside power or fuel to be operated.
The objective of this lab was to generate calibration curves of flow rate versus rotameter reading. It was also requested of us to generate calibration curves for the orifice meter (flow rate versus orifice pressure drop in mA) and the DP meter (flow rate versus pressure drop in psi). To obtain these calibration curves, we needed to calculate the mass flow rate for each rotameter setting (taking triplicates, n=3), and also for each pipe. It was also required to calculate the average velocity and Reynolds number for each pipe. Using the calibration curves obtained from our data, these were to be compared to historical class data to investigate the reliability and accuracy of the results we obtained. Additionally, we were asked to compute the standard error for determining mass flow rate from the pail and scale method.
Experimental:
The pail-and-scale method was used to determine the mass flow rate at each rotameter setting (20-70% by 10% increments) and in each of the three pipes. We used these mass flow rates to obtain both the average velocity at each rotameter setting and in each pipe and also the possible range of Reynolds numbers able to be measured within our laboratory setup. To obtain the desired flow rate percentages in the rotameter, the flow of water was set with a needle valve. To evaluate the rotameter, we measured the pressure drop across the orifice meter concurrently with six different flow rate percentages ranging from twenty to seventy percent. We took these measurements for each of the three pipe diameters; half inch, three eighths inch, and quarter inch. Two replicates were taken at each flow rate. Also, the water temperature was recorded for each measurement.
Results:
In total, thirty six measurements of pressure drop versus flow rate were obtained. The readings that were gathered in mA were converted to psi using the best fit line of the calibration curve for lab station 3. To calculate the mass flow rates, the pail and scale method was used. Measurements of time and weight were accumulated during a time interval. The mass flow rates were converted to volumetric flow rates using the density of water and unit conversions. The volumetric flow rates were used to calculate average velocity using the cross sectional area (see equation 1). In equation 1, Q is the volumetric flow rate, <v> is the average velocity, and A represents the cross sectional area.
Q=<v>*A (1)
The Reynolds number for each measurement was calculated using equation 2, where Re is the Reynolds number, ρ is the density of water, ID is the pipe diameter and µ is the viscosity of water.

Discussion
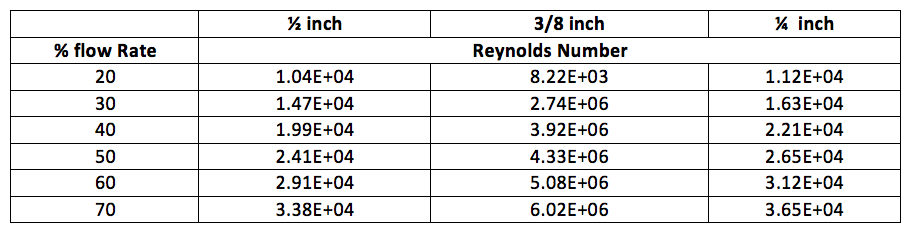
The flow rates chosen in our experiment were from 20% up to 70% percent flow. These flow rates all displayed turbulent flow this can be depicted in table 1.
Table 1 depicts the percent flow rate from the rotameter with the correlating Reynold’s number for 1/2, 3/8, 1/4 inch pipes. This gives numerical justice to the fact that all pipes at percent flow rate from 20% – 70% display turbulent flow.
There is barely any effect from the pipe diameter displayed on the rotameter calibration curve. Figures 1, 2, and 3 all show relatively the same slope. The best fit line for each calibration curve can also support this claim. The claim can be justified through the best fit lines. Figure one’s best fit line has a slope of 0.0494, figure two’s has a slope of 0.0482, and figure three’s has a slope of 0.0492. This also correlates with Lab Group three’s hypothesis that the pipe diameter would not make a difference with the rotameter calibration.
The rotameter calibration curves had similar slopes across all pipe diameters, therefore only one pipe diameter graph was chosen to correlate between past calibration curves. Fall 2013’s ½ inch pipe’s calibration curve compares to historical data fairly well according to figure four especially when the percent flow rate was smaller such as at the 20% mark. The other comparisons with pipe diameter and historical values for that pipe can be found in the appendix.
The orifice calibration curve was comparable to historical data at small flow rates. The calibration curve then varied greatly with the historical data. The fall 2013 was slightly higher than the data from 2008, but lower with in comparison to the 2011 lab data. This is most likely due to the reporting of calibration curves. In 2008 and in 2013 the calibration curve best fit line was a linear fit whereas the 2011 best fit curve was a quadratic fit. The conflict can be seen in figure five. Otherwise Lab Group three is under the impression that the orifice calibration curve for 2013 would fit the historical data fairly well without this difference.
The highest measured flow rate was found at 70% flow rate at the rotameter which was found to be 3.61 gallons per minute in the ½ inch pipe. The lowest flow rate that can be achieved is at 4.5 mA which comes from the lowest DP meter reading obtained for station three from the DP meter lab. This value was plugged into our line of best fit equation of the flow rate versus pressure drop in mA graph, and this yielded 0.6348 gallons per minute in the ⅜ inch pipe
The range of standard errors for the pail-and-scale method are as low as 6*10^-5 for half inch pipe at 50% flow rate, and are as large as 4.8*10^-3 for the quarter inch pipe at 40% flow rate. Overall, the standard error for this method of calculating flow rate is relatively small considering all of the possible places for human error (i.e operating the scale (tarring) and stopwatch correctly, unit conversions).
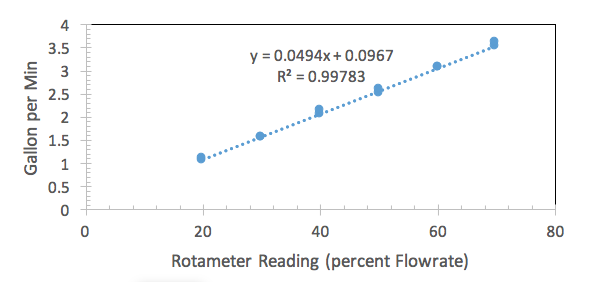
Figure 1 is a graph for a 1/2 inch pipe diameter relating flow rate in gallons per minute versus rotameter reading of percent flow rate.
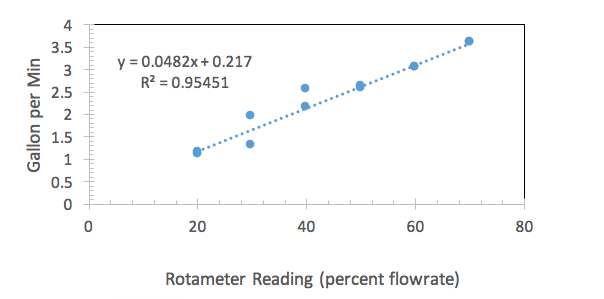
Figure 2 is a graph for a pipe with a 3/8 inch diameter plotting flow rate in gallons per minute versus the rotameter reading in percent flow rate.
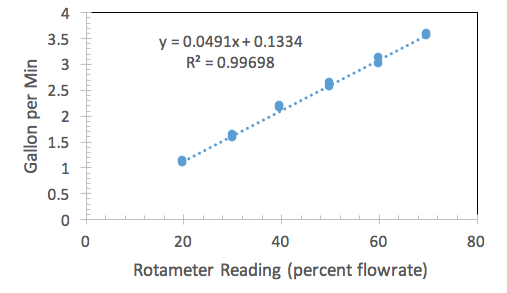
Figure 3 is a graph for the 1/4 inch pipe diameter plotting flow rate in gallons per minute versus a rotameter reading in percent flow rate.
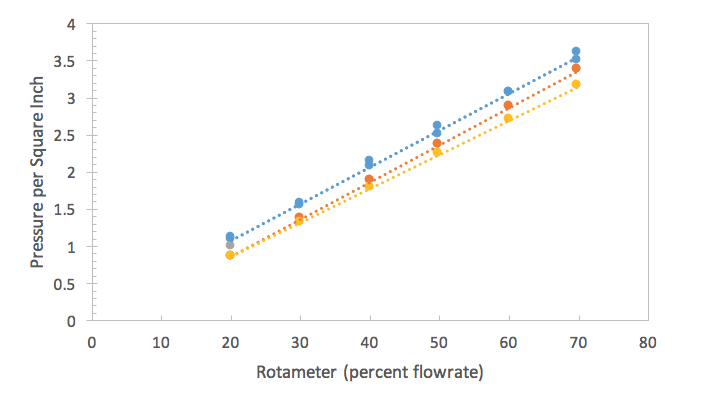
Figure 4 is a graph correlating to the 1/2 inch pipe denominator for historical calibration curves in 2010 and 2008 and, present, 2013. This is plotting PSI versus rotameter percent flow rate.
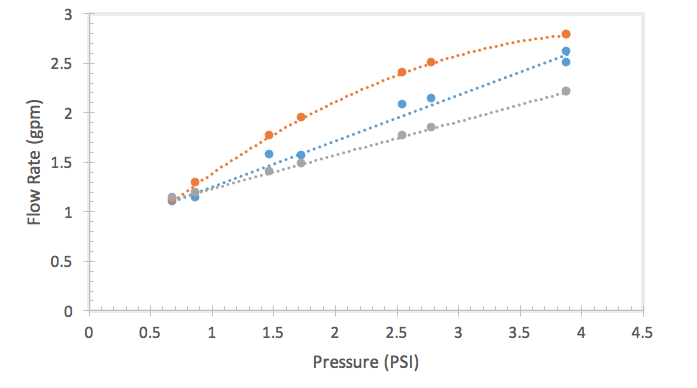
Figure 5 is a graph plotting flow rate versus psi in regards to the orifice meter. Here, one can see the outlier line from 2011. The other two lines which are similar to one another are from 2013 and 2008.
Conclusion:
The rotameter calibration curves for the three different pipe sizes all showed linear correlations between flow rate and pressure drop. The orifice meter calibration curves showed similar linear trends with some slope variation. The data obtained for this lab group showed very similar behavior to past classes literature calibration curves (i.e they were all linear). The values of Reynolds number calculated from differing pipe diameters and average viscosities all displayed turbulent flow.
References:
Faith A. Morrison, “Data Archive for CM3215 Laboratory Data,” Department of Chemical
Engineering, Michigan Technological University, Houghton, MI, available at
www.chem.mtu.edu/~fmorriso/cm3215/archive.html , accessed 12 October 2013.
Faith A. Morrison, “Calibrate Flowmeters and Explore Reynolds Number”, Department of Chemical Engineering, Michigan Technological University, Houghton, MI, available at www.chem.mtu.edu/~fmorriso/cm3215/Procedures/Viscosity.pdf, accessed 13, October 2013.
Copper Development Association, “The Copper Tube Handbook”, available at http://www.chem.mtu.edu/~fmorriso/cm3215/copper_tube_handbook.pdf, accessed 11, October 2013.
