Carbonate Alkalinity Determination
Introduction
Acid Mine Drainage (AMD) is a very pressing environmental issue in today’s society; Colorado is particularly impacted by the presence of AMD. AMD impacts watersheds by lowering the pH and reducing the alkalinity of natural waters. Using samples collected at the Captain Jack Superfund Site (an AMD site where the Big Five Tunnel drains into Left Hand Creek) we measured the alkalinity in the drainage from the Big Five Tunnel as well as above and below the confluence of the BFT drainage with Lefthand Creek.
The alkalinities of samples were determined with a strong acid (H2SO4) titration. The strong acid concentration was standardized by titrating it into a sodium bicarbonate solution of a known concentration. The purpose of this lab was to understand the acid-base chemistry behind the carbonate alkalinity measurement and identify the impacts of AMD on pH and alkalinity.
Materials and Methods
The pH of the solutions titrated was monitored using an Orion 3 Star pH meter and Orion Refillable Ag/AgCl pH Electrode, which was calibrated using pH 4.0 and 7.0 standards. By titrating a sodium bicarbonate standard the concentration of the sulfuric acid titrant was determined. The sodium bicarbonate was titrated by incrementally adding 1 mL of sulfuric acid to 100 mL of the sodium bicarbonate in a 150 mL beaker, while being stirred on a stir plate, with a stir bar. The pH of the titration mixture was monitored until the pH was 3.71. We determined the exact concentration of the sulfuric acid to be 0.00106 M, with a Gran Function Curve (Figure 2). The upstream LHC, downstream LHC, and BFT were titrated in a similar fashion. Using samples of 25 mL for the Lefthand Creek and Big Five Drainage Tunnel, it was known that they would titrate much quicker than the 100 mL of sodium bicarbonate, therefore low titrant volumes (approx. 0.5 mL) of sulfuric acids were used.
Results
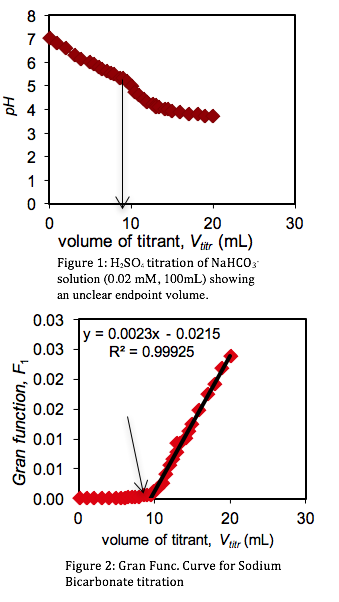
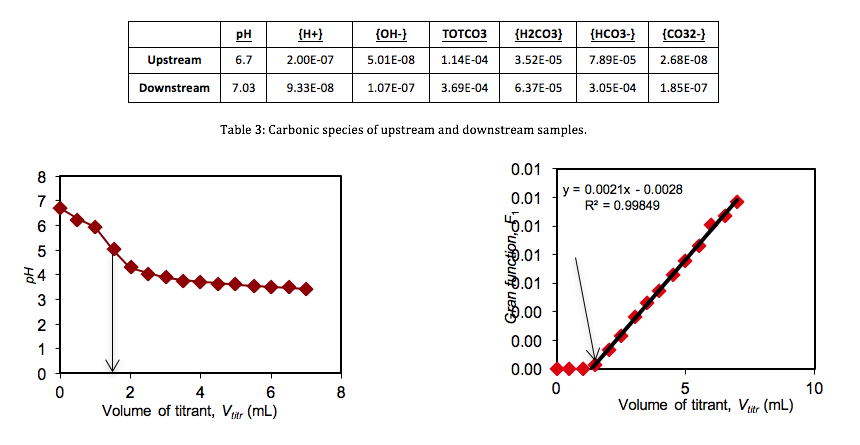
Standardization of Sulfuric Acid Titrant. To determine the concentration of the sulfuric acid titrant, 100 mL of sodium bicarbonate was titrated with the sulfuric acid standard. Measuring the variations in the pH of the sodium bicarbonate solution, a titration curve was plotted (Figure 1). However, the titration end point volume was not readily visible on the titration curve. To provide better resolution The Gran Function, a measure of the number of moles of H+ added to the solution after the end point has been reached, was calculated.
Plotting a regression line of the Gran Function,
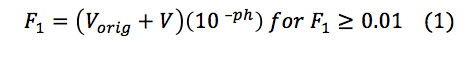
where Vorig is the of the solution being titrated and V is the volume of titrated, provided the end point volume, which is the CO2 equivalence point (Fig. 2, x-intercept). Knowing the volume at the titration end point (Vtitr = 9.347 mL) the concentration of sulfuric acid was determined as followed:
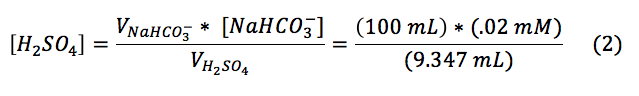
Using these parameters the concentration of sulfuric acid was found to be 0.00106 M.
| Upstream Sample | Downstream Sample | Big Five Drainage | |
| pH | 6.7 | 7.03 | 3.47 |
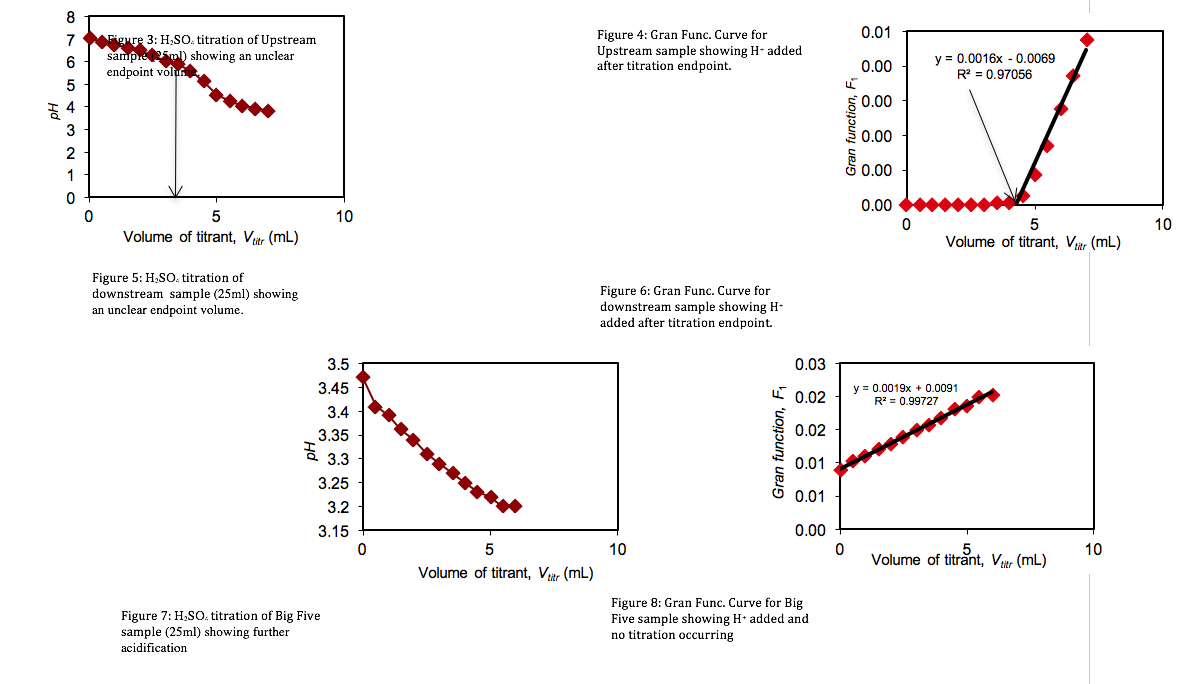
Titrations of three Lefthand Creek Samples. The alkalinity of the three Lefthand Creek samples was determined through the sulfuric acid titration described above.
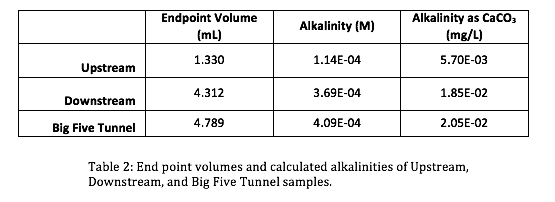
The initial pH’s (Table 1) of the three samples were lowered progressively by titrant volumes of 0.5 mL increments. Titration curves and Gran Function curves were then plotted for the upstream (Figs. 3 & 4), downstream (Figs. 5 & 6), and the Big Five Tunnel (Figs. 7 & 8). The endpoint volume, alkalinity, and alkalinity as calcium carbonate for each sample are displayed in table 2.
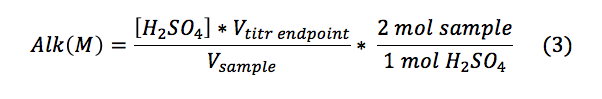
The alkalinities for the samples were calculated using Equation 3.
The alkalinity as calcium carbonate was found using the molecular weight of calcium carbonate as described in Equation 4:

Discussion
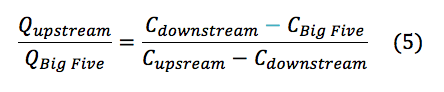
Analyzing the data acquired through methods described above there are several anomalies that must be addressed. The initial pH’s reading for the three samples (Table 1) are not what we expected. Since the AMD has a significantly lower pH (3.47) than the upstream (6.70), we expected the downstream to have a pH in the range of the converging discharges; rather the downstream had a higher pH than the upstream (7.03). This leads us to believe that in between the convergence and the location of the downstream sample, the water must have encountered a basic entity. It is widely recognized that creeks in Colorado contain large amounts of carbonate rocks, such as limestone, contact with a rock such as limestone would explain the increase in pH for the downstream water of LHC. The alkalinity mixtures suggest that the Lefthand Creek has a significantly greater flow than that of the drainage, which visually makes sense. Performing a mass balance (eqn. 5) for the ratio of the Upstream Creek flow to Big Five flow quantified to a -3.05 times greater flow in the upstream portion of the Lefthand Creek than the drainage. This clearly does not make sense physically, this further suggested the interaction of the downstream with a carbonate species nulling the results of the mass balance.
Based on the pH’s and alkalinities measured in the elaborated processes, the estimated concentrations of the carbonic acid, bicarbonate and carbonate were found for the upstream and downstream samples (Table 3).
Evaluation
This lab was important because it further demonstrated the usefulness of titrations, and further illustrated the concepts buffering and alkalinity. Most importantly this lab illustrated the need to perform multiple sample collections and multiple tests, as where our sample showed an increased pH downstream, however, other downstream samples (as expected) showed a decrease in pH.
