Determination of Cupric Sulfate Hydration Number
By: David Gould
This experiment consisted of creating various concentrations of copper solutions, and measuring the absorbance of each in an atomic absorption spectrophotometer. The absorbances were used to create a calibration curve, the equation from which was used to calculate an experimental concentration for the unknown I was given. This was found to be 875.3 ppm copper for Unknown #1. Further calculations showed that this gave a hydration number of approximately 2, meaning the unknown was cupric sulfate dihydrate.
Procedure: All glassware used in this experiment was first cleaned by rinsing three times with DI water, filling with 10% nitric and letting sit for 10 minutes, then rinsing again with DI water three times.
Using 999.7 ppm copper solution, 5 calibration standards were prepared containing 0.5% nitric acid and diluted with 18 MΩ water. The same was done to prepare the unknowns, taking into account the unknowns were cupric sulfate rather than just copper.
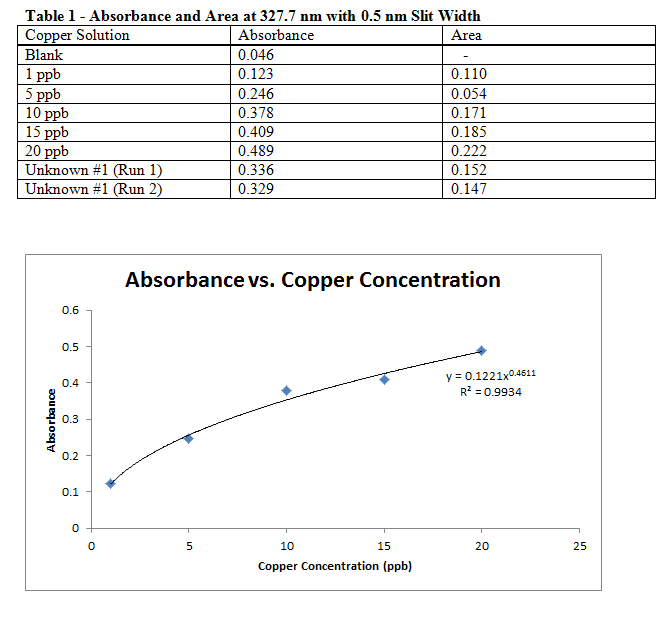
To prepare the Varian SpectrAA 20 instrument, the machine was calibrated using an index parameter for a copper lamp at 0.5 nm slit width. After manually adjusting the wavelength to find the maximum signal, 327.7 nm was used for all measurements. A blank containing no copper was first measured, followed by the five standards and finally the unknowns. All absorbance values, as well at peak areas, were recorded.
Results:
Comments:
It is being assumed that the 1 ppb and 5 ppb standards were placed in the AAS in the wrong order, so the data table above does not match the recorded results from the lab manual. Even with the data in the observed order, and excluding the 1 ppb “anomaly,” the adjusted data makes a much better calibration curve.
Based on the calculations, it would seem that my sample was a dihydrate. However, this may be in error since I know trihydrate and monohydrate are more common (and what we were supposed to achieve). This error could be due to an incorrect measure of absorbances, or just the calibration curve in general. It is more likely to actually be cupric sulfate trihydrate.
Another possibility for the anomalous hydration number for the sample could be errors during the dilutions. A small error in just the first preparation would be exaggerated greatly in proceeding dilutions, and would cause progressively larger errors. Although care was taken in making both the standards and the unknown solutions, when using such precise amounts (such as 10 μL) there is a greater percentage of associated uncertainty. This would have caused errors that gave an incorrect hydration number for the unknown.
The areas found in the above graph were recorded in case there was no discernible trend using absorbances, but since these matched decently with the concentrations (see calibration graph), they were not actually used for a graph or any calculations.
References:
Cissell, K. Chem 314 Lab Manual, University Center, MI, 2014
ScienceLab.com/MSDS. Accessed February 2, 2014
Physics.NIST.gov/PhysRefData. Accessed February 2, 2014
Appendix
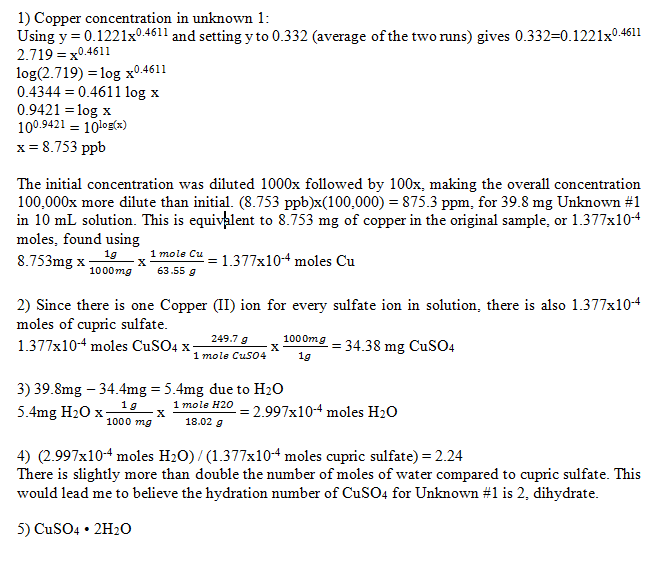
Calculations: