Determination of Salicylate via Reaction with Fe(III)
Determination of Salicylate via Reaction with Fe(III)
By: Andrew Tam
Introduction
This experiment was performed to study aspects of spectroscopic analysis. To do so, we used an Ocean Optics spectrophotometer to collect optical absorbance spectra for different solutions. In doing so, we also aim to investigate the stoichiometry of reactions using the method of continuous variation. We did so by studying the absorbance of a salicylate complex. Salicylate and salicylic acid are common chemicals found in medications that are used to treat acne, headaches, and similar problems. By studying its properties, we can further our understanding of this substance so that it can aid us in the future.
We measured the analyte, which is the substance that is being studied, using spectrophotometry. This involves shining light on a sample and observing how it reacts. In this case, it will absorb some of the light and the rest of the light will shine through to reach a detector which will measure the intensity of the output of light to measure absorbance. This can be studied using Beer’s Law, which is presented in section “Part A”. This method is used because salicylate itself cannot absorb visible light, but when reacted with iron (III) ions, it produces a color within the visible spectrum, which can then be measured through spectrophotometry.
Part A – Salicylate Determination
Results and Discussion:
In order to study absorbance and spectroscopy, we must construct a calibration curve of absorbance with concentration. The theory is that this will be a linear plot similar to Beer’s Law:
(1) Absorbance = molar absorptivity constant(Lcm-1mol-1) * path length (cm) * concentration (mol/L)
We used concentrations of 10, 25, 40 60, 75 mM. With this, the generated calibration curve is shown below in Figure 1.
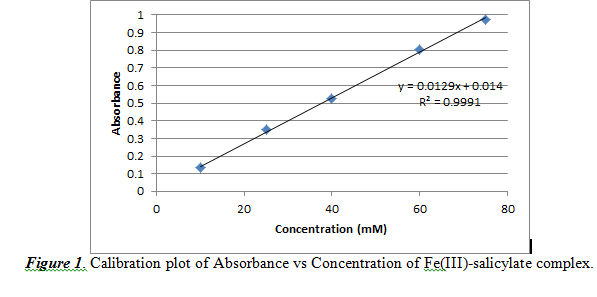
From Figure 1, we observed a practically linear relationship between concentration and absorbance. The slope (0.0129 ±0.0002) corresponds to the (absorptivity constant * path length) value of Beer’s Law. The intercept is noted to be 0.0140±0.0110. The R2 value is 0.9991, which shows that the data is almost linear, but not perfectly linear.
From this calibration plot, we can measure the concentration of salicylate in acne medication by analyzing the absorbance result for a certain sample. However, the concentration must be reported in weight percent. Therefore, we must use this formula to convert from concentration (M) to weight percent:
(1) Molarity(mol/L) * molecular weight (g/mol) / density (g/L) = weight percent
The density of the acne medication was observed to be 0.8562 g/mL or 856.2g/L and the molecular weight of salicylate is 137.11 g/mol. Using absorbance results of 0.885, 0.838 and 0.882, the average weight percent resulted in being 1.06±0.04%. We then must calculate a 95% confidence interval to compare with the mean result from the class data. To do so, we needed the following formula:
(2) Confidence interval = [µ – Z*s/(n^0.5) , µ + Z*s/(n^0.5)]
µ is the mean of the sample, Z* is the critical value for the confidence interval, s is the standard deviation of the mean, and n is the sample size. The Z* value for a 95% confidence interval is, with degrees of freedom n-1 = 3-1 = 2, 2.92, and s was 0.04. This gives a confidence interval of [0.99,1.13] %. This confidence interval signifies that if this process were to be repeated infinitely many times, then 95% of those intervals would contain the true value of the mean.
The class mean for the acne medication was 8.29%. This value is not contained in the confidence interval that we created. Therefore, this means that our confidence interval is not a reliable interval to use and we must create a new one with a different set of sample data. However, if we compare our mean value with the stated value on the bottle, it is 1.00%, which is closer to our confidence interval and would be inside our confidence interval.
Next, we had an unknown sample that contained salicylate that we must calculate the concentration. We did so by using the calibration graph. Our sample was number 49. With absorbances of 0.524, 0.514, and 0.550, we get concentration results of 39.5, 38.8, and 41.8 mM. This results in a mean of 40.0±1.5 mM. Again, using equation 3, we can create a confidence interval, with the same Z* and n. This confidence interval is [37.47,42.5] mM. This interval, again shows that if the same procedure was repeated, the resulting confidence interval would contain the true value 95% of the time.
Conclusions:
This experiment was done to study absorbance and spectrophotometry. We did so by creating a calibration graph so that we can observe the relationship of the absorbance of salicylate with the concentration. The resulting graph is a linear graph showing a direct relationship of absorbance and concentration. We then used this graph to figure out the concentration of an acne medication. However, the resulting mean and confidence interval shows that it was not accurate with the true value, which the class mean was used as.
There were a few sources of error. The biggest would be incorrect input of the class data. There are some values that are greater than 5%. These values drastically increased the class mean, which caused it to not be contained in our confidence interval. There is also an error where there might be some residues in the cuvette that would affect the reading of the absorbance.
Part B – Determination of Reaction Stoichiometry
Results and Discussion:
This part of the experiment explored the stoichiometry of the reaction of iron and salicylate. This can be done by creating a Job’s Plot, which is a graph of continuous variation of the mole fraction with absorbance. The concentration that has the highest absorbance means that it is the predominant complex. This graph can be observed in Figure 2.
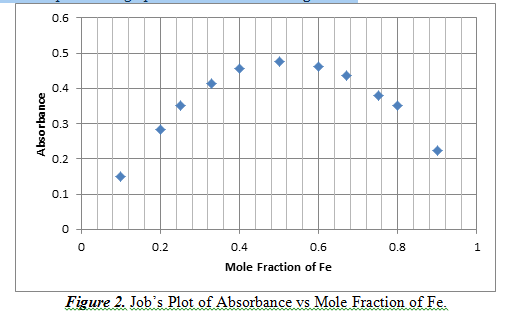
From Figure 2, we can see that at a mole fraction of 0.5 Fe, there is a maximum of absorbance result. A mole fraction of 0.5 means that there is an equal amount of moles of Fe reacting with salicylate. This shows that the complex of iron and salicylate is at a 1:1 ratio.
Conclusions:
This part of the experiment shows that the reaction mechanics of the iron and salicylate peaks at a 1:1 ratio. This also shows that this set up is the most favorable in creating this complex. Some errors in the part of the experiment are that there was some human error in creating the mixes with different concentrations, but it did not hinder the data significantly; a very distinct and convincing scatterplot is still a result of our data.
References:
Harris, Daniel C. Quantitative Chemical Analysis. 8th ed. New York: W.H. Freeman, 2010. Print.
