Enzyme Kinetics- Determination of the Kinetic Parameters for Tyrosinase
Enzyme Kinetics- Determination of the Kinetic Parameters for Tyrosinase
By: Trevor Frisby & David Darby
Abstract
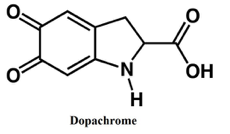
In this Kinetics laboratory experiment the enzyme tyrosinase was investigated in the presence of two types of inhibitors: sodium cyanide and a synthesized inhibitor, dimethoxy azo-stilbene. Tyrosinase, also known as monophenol monooxygenase utilizes oxygen for the catalysis of two separate reactions that involve the hydroxylation of monophenols to diphenols, and also the oxidative conversion of diphenols to quinones. Through these chemical pathways tyrosinase catalytically converts the substrate, L-Dopa into dopachrome, a highly colored substance. Through the aid of a series of Michaelis-Menten equations and graphs, a collection of lineweaver-burk plots were constructed to determine the kinetic parameters Km, Vmax and Ki. It was found that sodium cyanide possessed the properties of a mixed inhibitor. However, there were no results obtained from the enzymatic assays of the inhibitor dimethoxy azo-stilbene. The type of inhibition dimethoxy azo-stilbene exhibits still remains inconclusive.
Introduction
The study of enzyme reaction rates is a very important topic to consider when deciphering the reaction mechanism of a particular enzyme. During an enzymatic reaction, the rate of the reaction and how this rate changes when exposed to different conditions is a significant indicator of how the reaction mechanism occurred. Considering the structure of the enzyme, its catalytic mechanisms and the kinetic data retrieved from these enzymatic reactions, can provide very important information with regards to the enzyme’s biological function and possible modifications for therapeutic uses (1).
The enzyme Tyrosinase, also known as monophenol monooxygenase is a widely occurring type of enzyme found in microorganisms, plants and animals. Its active site consists of 4 copper atom binding sites. Tyrosinase utilizes oxygen for the catalysis of two separate reactions that involve the hydroxylation of monophenols to diphenols, and also the oxidative conversion of diphenols to quinones (3) (2). These quinones generated are responsible for the formation of melanin through polymerization reactions and enzymatic/non-enzymatic subsequent reactions.
Melanin is the pigment found in skin, hair and the retinas of vertebrates and is also found in many disease states resulting from abnormal melanin pigmentation (2) (3). The production of this melanin stems from the ability of Tyrosinase to bind a phenolic substrate at one binding site and one dioxygen molecule at another site (3).
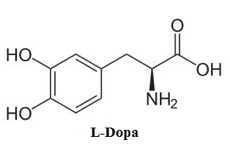
There is a significant convenience working with Tyrosinase and dopachrome since dopachrome is highly colored when it is being synthesized by Tyrosinase. This enables the spectrophotometer to effectively measure the absorbance of the conversion of the diphenols substrate to dopachrome, hence assessing the rate of the reaction. When conducting a series of kinetic assays it is important to have an idea of the kinetic parameters that will be considered. The kinetic parameters that will be utilized within this report include Km and Vmax for the Tyrosinase reaction with the substrate L-Dopa. Also, the Ki of a known Tyrosinase inhibitor, NaCN, and the Ki of a synthesized inhibitor dimethoxy azo-stilbene will be determined. The type of inhibition for both of the inhibitors will also be determined based on the line-weaver burk plots (3).
Azo-stilbenes have been utilized over the past years for their chromophore properties as they produced a wide variety of dyes consisting of brilliant colors. They also functioned as radical initiators, therapeutics and drug delievery agents (4). Azo type compounds are also involved in certain biological reactions such as inhibition of DNA/RNA and protein synthesis (4). It wasn’t until the year 2012 when it was discovered some of these azo-stilbene compounds possessed inhibitor potential (3).
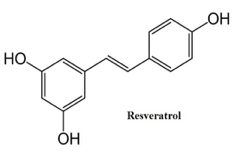
The method in our lab for synthesizing an azo-stilbene inhibitor originated from the naturally occurring compound resveratrol. It consists of a stilbene structure and is found in grapes, berries, peanuts and red wine. Resveratrol attracted a lot of attention within the medicinal community primarily due to its ability to serve as a very strong anti-oxidant. Resveratrol’s key structural characteristics lie in its double bond connecting two phenolic rings which can be susceptible to E/Z isomerization. However, previous studies indicate that resveratrol has not been exploited for E/Z isomerization on its central double bond. It wasn’t until recently where non-symmetric azo aromatic compounds were synthesized and investigated for their inhibitory abilities (4). Therefore, based on the syntheses described for azo-resveratrol analogs, very similar reaction conditions were implemented for the synthesis of our inhibitor dimethoxy azo-stilbene. The reaction conditions utilized a single green step from the reaction of phenols and anilines in the presence of NaNO2 followed by sodium hydroxide and 3M HCl (3). The synthesis of this inhibitor is a valid asset to test for inhibition against the enzyme Tyrosinase. The kinetic parameters mentioned previously must be determined for this azo-stilbene inhibitor and also a NaCN inhibitor which is known to inhibit Tyrosinase (3).
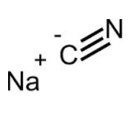
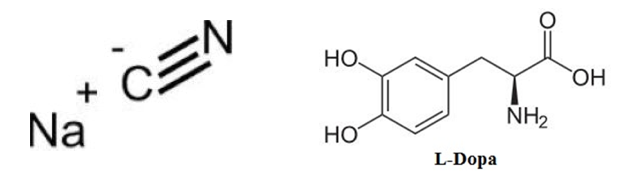
In a study of the kinetic and physiochemical properties of mushroom Tyrosinase, sodium cyanide (to the right) was found to inhibit Tyrosinase by mixed competitive inhibition (5). Since sodium cyanide exhibits mixed competitive inhibition, this is a good source to investigate its inhibitory abilities and to confirm its mode of inhibition on Tyrosinase.
Enzyme kinetics usually follow the Michaelis-Menten equation and through the manipulation of a series of these equations it is possible to design lineweaver burk plots and Michaelis-Menten graphs to determine the type of inhibitor you are testing; whether it may be non-competitive, mixed competitive, or competitive. In uncompetitive inhibition, the inhibitor binds to the enzyme-substrate complex and not directly to the enzyme itself. The inhibitor doesn’t have to resemble the substrate complex in order to inhibit the enzyme. It distorts the active site when it attaches to the enzyme-substrate complex which in turn deactivates the enzyme. The inhibitor in uncompetitive inhibition affects the catalytic function of the enzyme but does not affect the substrate binding (1). The double reciprocal plot entails a series of parallel lines with slope Km/Vmax, 1/Vo intercepts of α’/Vmax and 1/[S] intercepts of –α’/Km. Once a lineweaver-burk plot is constructed for the enzyme and inhibitor, if the lines on the plot have identical slopes of Km/Vmax the inhibitor is uncompetitive (1). In mixed inhibition the inhibitor binds to both the enzyme and the enzyme-substrate complex. Therefore, mixed inhibitors not only interfere with the binding of the substrate to the enzyme but they can also affect the catalytic activity of the enzyme. In the lineweaver-burk plot of a Michaelis-Menten enzyme and mixed inhibitor the lines on the graph intersect to the left of the 1/Vo axis. Double reciprocal plots in the context of mixed inhibition possess lines that also have the slope αKm /Vmax, 1/Vo intercepts of α’/Vmax and 1/[S] intercepts of –α’/Km. There’s a special case of non-competitive inhibition called pure non-competitive inhibition where the lines intersect on the 1/[S] axis at -1/Km. In competitive inhibition, the inhibitor competes directly with a normal substrate for an enzyme’s substrate-binding site (1). An inhibitor such as this resembles the substrate structure but does not perform the same reactions as the normal substrate; instead it inhibits the active site of the enzyme. A competitive inhibitor reduces the concentration of free enzyme available for substrate binding (1). The value of Ki for a competitive inhibitor can be determined from the plot of KappKM = (1+ [I]/Ki) KM versus inhibitor concentration, [I]; its intercept on the [I] axis, – KI. By comparing the Ki values of competitive inhibitors with different structures, this can provide insight about the binding properties of an enzyme’s active site and give clues to its catalytic mechanism (1). This is a primary example of where a Michaelis-Menten graph would be very useful in determining those parameters mentioned before.
Within the scope of this experiment the goal and objective is to primarily determine the kinetic parameters, Km and Vmax for the Tyrosinase reaction with substrate L-Dopa. Another objective is to determine the Ki of the assigned inhibitor NaCN for Tyrosinase and the Ki of the synthesized inhibitor dimethoxy azo-stilbene. With these combined sources of data the type of inhibition for both inhibitors will be characterized through the assistance of Michaelis-Menten plots and lineweaver-burk plots.
Methods and Materials
Week 1
In the first week of the Enzyme kinetics lab there were two objectives to be accomplished within the laboratory: the synthesis of the azo-stilbene inhibitor, the determination of the amount of tyrosinase to use for the rest of the experiment, the preliminary determination of the assigned inhibitor concentrations to use and to make a 0.1M phosphate buffer solution.
The 0.1M buffer solution was made by measuring out 13.6090g of monobasic potassium phosphate and adding it to a 1000ml beaker. About 700ml of distilled water was added to this amount of potassium phosphate and the mixture was placed on a stirring hot plate with a stir bar to dissolve the potassium phosphate in the water. Next, the pH meter was calibrated and the probe was placed into the beaker containing the potassium phosphate mixture. Sodium hydroxide was added to the mixture constantly until the required pH of 7 was achieved. Once the pH was attained the mixture was filled to the 1000ml mark with distilled water and transferred to a secondary container for the following week.
Synthesis of the dimethoxy azo-stilbene inhibitor
0.3836g of dimethoxy aniline was added to a 50 ml Erlenmeyer flask followed by 2.5 ml of ethanol. The flask was swirled and placed in a -5oC ice bath. 2.1 ml of 3M HCl was added into the flask and agitated slowly followed by an addition of 1.1 ml of 2.5M NaNO2 . This mixture produced a red-brown thick slurry. The mixture was swirled and then allowed to sit in the ice bath for about 30 minutes. During this 30 minute wait period 0.2593g of phenol was added to a 50 ml Erlenmeyer flask and it was dissolved with 5.25ml of 2M NaOH. After the 30 minutes this phenol NaOH mixture was added to the reaction flask that was sitting in the -5oC ice bath. After 10 minutes the flask was removed from the cold bath and was allowed to sit for 30 minutes. The solid formed from the reaction flask was a red-orange color. This solid product was then collected by suction filtration using a Buchner funnel. After suction filtration the dark red product was put on a watch glass and allowed to dry over the week.
The following week the entire dimethoxy azo-stilbene product was added to a 50 ml volumetric flask and approximately 40% DMSO was added to the azo-stilbene compound (carried out by Dr. Streu). The product had some problems dissolving in the DMSO so it was placed in a warm water bath to help it dissolve in the DMSO. Afterwards, it was removed from the water bath and the azo-stilbene product went into solution. This red-orange solution was then transferred to another container to be saved for the following week for kinetic assays where we would assess the inhibition properties of the azo-stilbene compound with the Tyrosinase and L-Dopa.
Determination of the concentrations of Tyrosinase and Inhibitor to use
To find the concentration of tyrosinase that would give a suitable rate an enzyme assay was conducted using a constant substrate concentration of 5mM for L-Dopa. A variety of volumes of tyrosinase consisting of: (0.025, 0.04, 0.05 ml) were used to find the suitable rate at which tyrosinase converts the substrate L-Dopa to dopachrome. Varying amounts of buffer solution were added to the assay mixtures to adjust to the 3 ml volume limit of the cuvette for each kinetic assay run. The wavelength at which each of these kinetic assays was run: 492nm. Absorbance vs. time was plotted for each run and the slope was determined of each curve. The amount of tyrosinase to use that gives a rate of 0.2 Absorbance units/ minute was estimated on each kinetic assay run based on the slopes that were produced. This concentration of tyrosinase was used for the rest of the laboratory experiments.
To find inhibitor concentrations that would give approximately 90% inhibition a series of kinetic assays were conducted where the concentration of substrate was kept constant at 5mM, the concentration of Tyrosinase used as 0.05mM, and the volumes of NaCN that were used: 0.001, 0.005, 0.01, 0.02, and 0.04 ml). It was determined that the NaCN inhibitor was very potent because the initial solutions of 0.05 and 0.01, for example, had to be diluted to 0.005 and 0.001 respectively by a 1:10 dilution. At a wavelength of 492nm, absorbance units vs. time were plotted for each kinetic run and the slope was determined for each curve. To determine the concentrations at which the inhibitor gave rates of about 10 and 50% uninhibition the slopes of the each kinetic assay run were examined and the slope that exhibited an inhibitor rate of about 10/50% uninhibition was chosen.
Week 2
Determination of Km, Vmax, and Ki
To determine the Km, Vmax, KI, and KI’, a series of enzyme assays were carried out using a constant amount of tyrosinase (5mM) and various volumes of substrate at concentrations of 0.25mM, 0.5mM, 1.0mM, 1.5mM 3.0mM, and 5.0mM. These kinetic assay runs were performed analogous to the subsection above (refer to: Determination of the concentrations of Tyrosinase and Inhibitor to use- the tyrosinase method), but instead the inhibitor concentration parameters consisted of runs with no inhibitor, 0.066mM of inhibitor, and 0.133mM of inhibitor.
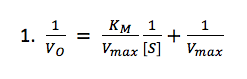
From these data, we were able to plot reaction rate as a function of substrate concentration. From this, we made a double reciprocal plot (Lineweaver-Burk), and with the uninhibited sample, solved for Km and Vmax according to the following equation:
We then solved for KI and KI’ using the following mixed-inhibiter equation:
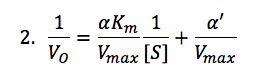
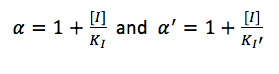
where
Results
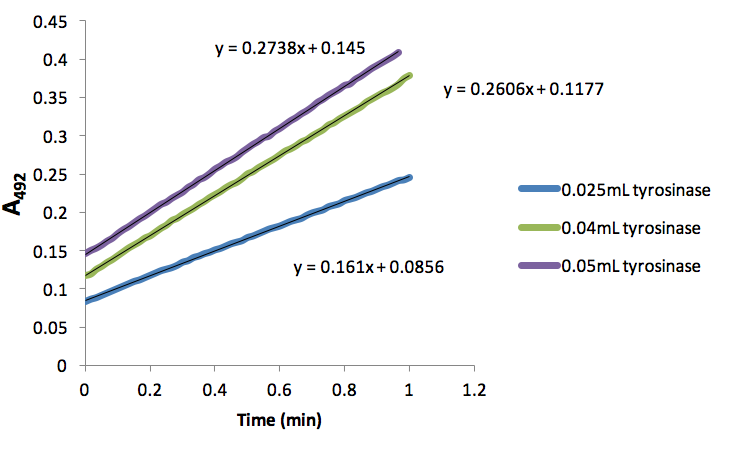
Figure 1. Absorbance (492nm) over time (min) of dopachrome produced by different volumes of tyrosinase with 5mM L-Dopa.
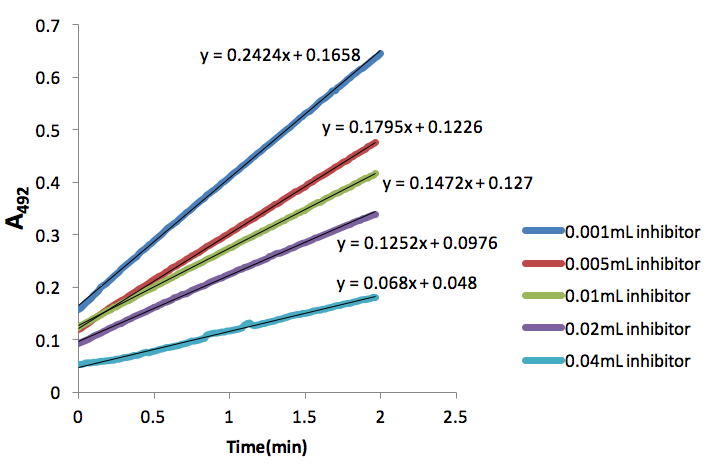
Figure 2. Absorbance (492nm) over time (min) of dopachrome produced by tyrosinase (50 units) and 5mM L-Dopa with different inhibitor (NaCN) volumes.
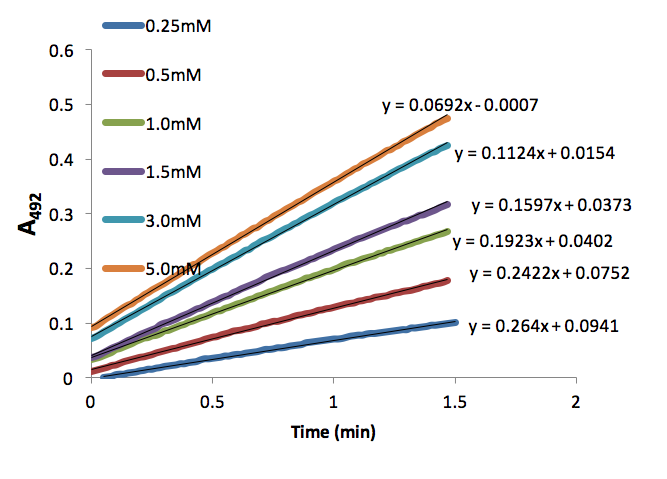
Figure 3. Absorbance (492nm) over time (min) of dopachrome produced by tyrosinase (50 units) with different L-Dopa concentrations (mM).
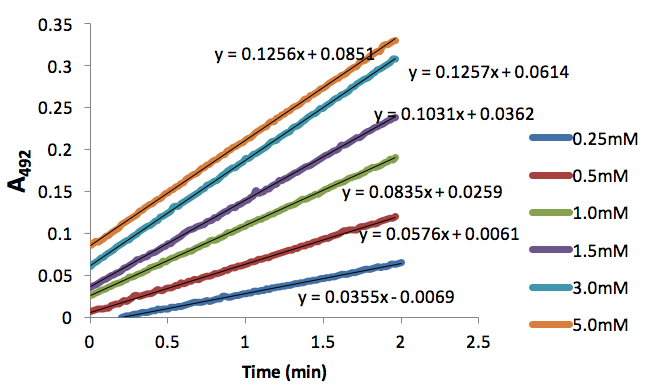
Figure 4. Absorbance (492nm) over time (nm) of dopachrome produced by tyrosinase (50 units) and different L-Dopa concentrations (mM) inhibited by 0.066mM NaCN.
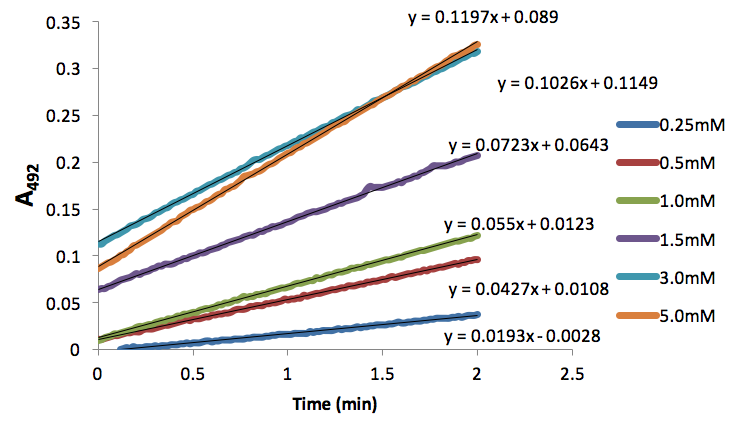
Figure 5. Absorbance (492nm) over time (nm) of dopachrome produced by tyrosinase (50 units) and different L-Dopa concentrations inhibited by 0.133mM NaCN.
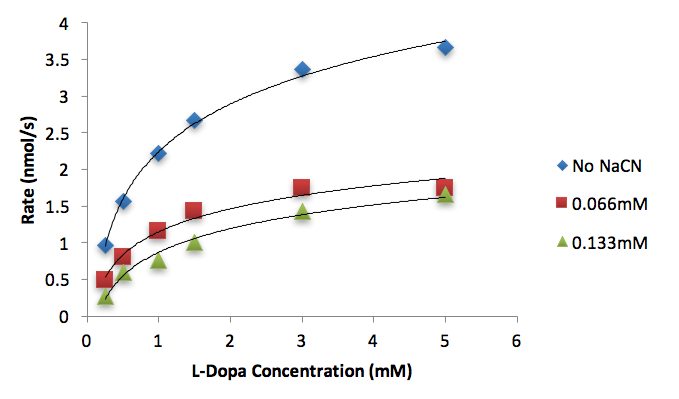
Figure 6. Conversion rates of differing L-Dopa concentrations (mM) to dopachrome by tyrosinase (50 units) inhibited by different NaCN concentrations (mM).
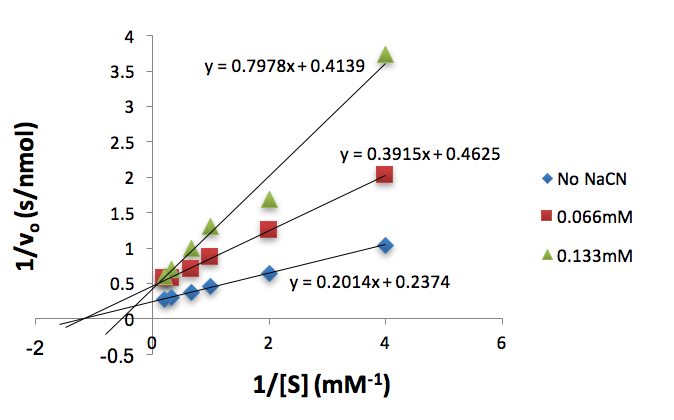
Figure 7. Lineweaver-Burk plot of tyrosinase (50 units) conversion of increasing L-Dopa concentrations (mM) inhibited by different NaCN concentrations (mM).
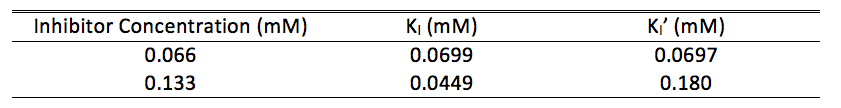
Table 1. Calculated KI and KI’ values for inhibitor concentrations
We found that 0.05mL tyrosinase provided a rate of 0.2738 A492/min (Fig. 1), which was close to the desired 0.20 A492/min. Thus, we proceeded using this volume of tyrosinase in all subsequent assays. Additionally, we determined that 0.066mM NaCN inhibited tyrosinase conversion of L-Dopa to dopachrome by 45.7%. This percentage was found by taking a ratio of slopes from the lines representing 0.02ml inhibitor (Fig. 2) and 0.05mL tyrosinase (Fig. 1). In a similar manner, we found that 0.133mM NaCN inhibited tyrosinase conversions of L-Dopa to dopachrome by 24.8%. We were unable to attain any weaker percent inhibition.
We used these inhibitor concentrations to plot absorbances (A492) of dopachrome converted from differing L-Dopa concentration as a function of time to obtain figures 3-6. We plotted the inverse of each axis in figure 6 to obtain the Lineweaver Burk plot in figure 7. From this, we used the equation for the line corresponding to no inhibitor (y=0.2014x+.2374) and calculated that Km=0.848mM and Vmax=4.21mMs-1. Table 1 indicates KI and KI’. We did not record any results for our synthesized Azo-Stilbene inhibitor, as it did not work as induce any inhibition.
Discussion
The study of enzyme kinetics is important in understanding the nature of molecular interactions. More specifically, we focused on the interaction between tyrosinase and L-Dopa with and without the inhibitor NaCN. It is important to note some of the trends that we observed. Figure 1 indicates the absorbance of tyrosinase as a function of time. We expect that for a given substrate concentration, tyrosinase activity will increase, indicated by an increasing slope (Fig. 1), as does its own concentration. However, this will eventually level off. This is because once tyrosinase concentration reaches a certain level, it will have bound to all the substrate, and thus have nothing left with which to interact (1).
Of more interest is this system with the addition of an inhibitor. The inhibitor that we worked with was NaCN. Figure 2 demonstrates the strength of NaCN as an inhibitor of tyrosinase. It induced a strong inhibitory effect at a micromolar concentration. This poses the question as to what type of inhibitor NaCN is. It is important to put this into the context of our results. Our Lineweaver-Burk plot does not clearly indicate what type of inhibitor NaCN is. As a mixed inhibitor, we would expect all of the lines to intersect at the same point in quadrant II in the graph. Rather, our plot exhibits elements of all types of inhibition, as points intersect along the x-axis, y-axis, and in the second quadrant. Since this cannot be the case, we must look at further evidence before making any type of classification.
Based on the knowledge that competitive inhibitors compete directly with a substrate for an enzyme-binding site, a competitive inhibitor must resemble the substrate complex in order for it to compete with the substrate binding site (1)(2). In the enzymatic reaction of L-Dopa being converted to dopachrome, in order for an inhibitor to compete with the binding site of L-Dopa, it must resemble or be identical to the structure of L-Dopa. Sodium cyanide’s structural formula does not resemble the molecular structure of L-Dopa, hence it is possible to eliminate the possibility that sodium cyanide is a competitive inhibitor (1) (2). Upon this realization, along with the non-parallel Lineweaver-Burk plot (Fig. 7), it seems likely that NaCN is a mixed inhibitor. This is supported by literature (5)(6).
Given that NaCN is a noncompetive inhibitor, its interaction with substrate is characterized by equation 2. from the methods. The corresponding KI and KI’ values are located in table 1. It is important to understand what these values mean and how different values affect substrate binding. The smaller the KI, the tighter the inhibitor binds to the enzyme. Very strong inhibitors are classified as having KI’s in the range of nanomolar concentrations (1). We did not test at this threshold, though we had to dilute our micromolar sample by 1:10 because of its strength. This would indicate that NaCN is still a strong inhibitor of tyrosinase. The relative magnitude of KI’ has similar implications.
While we were able to classify the inhibitory properties of NaCN, we were not as successful with the synthesized azo-stilbene. There are many possibilities why the synthesized dimethoxy azo-stilbene complex could not inhibit the tyrosinase enzyme. One possibility is that since the concentration of the DMSO solvent was approximately 40% of the Buffer solution, this may have caused a decrease in the ability of the azo-stilbene to inhibit the tyrosinase. Another possibility could be attributed to the fact that the dimethoxy azo-stilbene was not very soluble in the DMSO. Thus, if there is an attempt to react the azo-stilbene complex with the tyrosinase enzyme, if it is not completely dissolved in a buffer solution, this may compromise the inhibitory potential of the azo-stilbene complex (7).
Successive lab sections were able to collect meaningful data using their azo-stilbene upon switching substrate from L-dopa to tyrosine, an L-dopa precursor. This indicates some type of interaction between azo-stilbene and L-dopa that prevents it from binding with tyrosinase. Perhaps this is due to the extra hydroxyl group in L-dopa that causes some type of problem. In any case, an attempt to inhibit tyrosinase with azo-stilbene should be carried out with tyrosine as substrate rather than L-dopa. The reason for this is because the affinity properties (1/Km) and the catalytic power Vmax/Km increases with a decrease in the size of the side chain in the aromatic ring of the substrate. The presence of that one hydroxyl group on the aromatic ring of the substrate tyrosine compared to the presence of the two hydroxyl groups on the ring of L-Dopa makes a big difference in the catalytic power and affinity properties of tyrosinase (8).
Conclusion
NaCN was found to exhibit mixed inhibition based on structural analysis of the sodium cyanide molecule and realizing it did not resemble the substrate molecular structure. Hence, the possibility of the NaCN being a competitive inhibitor was eliminated. The lineweaver-burk plots ruled out it was not an uncompetitive inhibitor. The dimethoxy azo-stilbene on the other hand showed no signs of inhibition and the results of the kinetic assays remain inconclusive.
An important aspect to note is that the lineweaver-burk plot was not accurately depicting the expected mixed inhibition plots so we believed there was some type of error associated with the lineweaver-burk plots. These sources of error could be attributed to insufficient mixing of the cuvette solutions before they were placed in the spectrophotometer. There also could have been incorrect concentrations for each kinetic assay run due to inaccurate pipetting. In conclusion, for future laboratory experiments, it would be a good idea to use tyrosine as the substrate when using an azo-stilbene inhibitor of tyrosinase. This idea is mainly based on the fact that other lab sections were able to collect data when they switched their substrate to tyrosine.
Citations
- Voet, D., Voet, G. J., Pratt, W. C., Fundamentals of Biochemistry Life at the Molecular Level, Fourth Edition, 2013 Chapter 12 “Enzyme Kinetics, Inhibition, and Control”
- Matsuura, R.; Ukeda, H.; Sawamura, M., Tyrosinase Inhibitory Activity of Citrus Essential Oils. Journal of Agricultural and Food Chemistry 2006, 54 (6), 2309-2313.
- Biochemistry Laboratory Manual Fall 2013 Experiment #7: Enzyme Kinetics – Determination of the Kinetic Parameters for Tyrosinase.
- Song, Y. M.; Ha, Y. M.; Kim, J.-A.; Chung, K. W.; Uehara, Y.; Lee, K. J.; Chun, P.; Byun, Y.; Chung, H. Y.; Moon, H. R., Synthesis of novel azo-resveratrol, azo-oxyresveratrol and their derivatives as potent tyrosinase inhibitors. Bioorganic & Medicinal Chemistry Letters 2012, 22 (24), 7451-7455.
- Duckworth, H.W.; Coleman, J.E.; Physicochemical and Kinetic Properties of Mushroom Tyrosinase. Journal of Biological Chemistry 1970, 245. 1613-1625.
- El-Bayoumi, M. A.; Frieden, E., A Spectrophotometric Method for the Determination of the Catecholase Activity of Tyrosinase and Some of its Applications1. Journal of the American Chemical Society 1957, 79 (18), 4854-4858.
- Broom, A. D., Rational design of enzyme inhibitors: multisubstrate analog inhibitors. Journal of Medicinal Chemistry 1989, 32 (1), 2-7.
- Seo, S.-Y.; Sharma, V. K.; Sharma, N., Mushroom Tyrosinase: Recent Prospects. Journal of Agricultural and Food Chemistry 2003, 51 (10), 2837-2853.
