Kinetics Lab – Methanolysis of Diethyl Succinate
Abstract:
The purpose of this experiment is to determine the rate constant and activation energy in the first step of the methanolysis of diethyl succinate. The rate constant is determined by analyzing the amount of diethyl succinate present in the reaction mixture at different times in a Gas Chromatogram. The k1 at 50 degrees Celsius was .0298 while the k1 at 60 degrees Celsius was .0332.
Introduction:
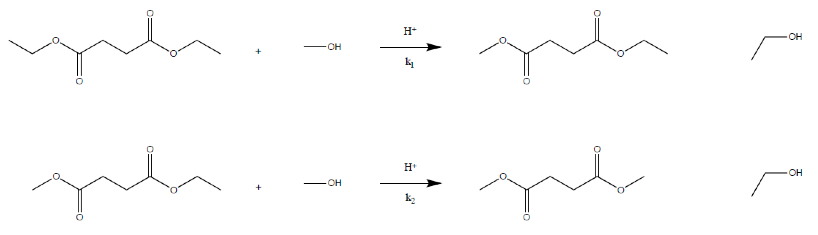
Gas Chromatography can be used to analyze the kinetics of a reaction that involves volatile compounds. The Gas Chromatograph analyses the relative amounts of different compounds in any given sample, it often shows the relative amounts of each compound as a fraction of the sample delivered. We will be analyzing the first step of the methanolysis of diethyl succinate. The reaction sequence can be seen in figure 1 below. First diethyl succinate reacts with methanol to form ethanol and ethyl methyl succinate. The ethyl methyl succinate formed reacts with another methanol molecule to form dimethyl succinate and ethanol. Although the reaction depends on the concentration of both diethyl succinate and methanol, we use an excess of methanol, so the methanol used in the reaction changes by a negligible amount. The reaction will appear to only depend on the concentration of diethyl succinate; this is known as pseudo first order.
The value of k1 at a given temperature for the reaction can be determined using the following equation:

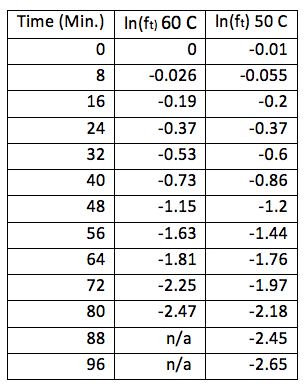
ft is the fraction of diethyl succinate at time t. The fraction of diethyl succinate at time t is measured by the gas chromatograph. f∞ is the fraction of diethyl succinate at infinite time and is assumed to be 0. Plotting a graph with Ln (ft) on the y-axis and -t on the x-axis gives a slope equal to k1 of the reaction. The activation energy of the reaction can then be determined by using the following equation:

k is the rate constant determined by plotting equation 1, Ea is the activation energy, R is the gas constant, T is the temperature at which the rate constant was determined (either 50 or 60 degrees C) and A is the pre-exponential factor.
Methods and Materials:
All chemicals used in this experiment were used as received with no further purification. 15mL of methanol (HPCL grade, Fisher Scientific, 0.2 micron filtered, containing molecular sieves, Lot#136153) and 5ml of diethyl succinate (98%, Alfa Aesar, Lot#10146669) were added to a 50-mL Erlenmeyer flask using a 100mL beaker. A 0.100mL aliquot of the solution was withdrawn from the flask using a 20-200 µL Bio-rad micropipette and placed into a glass vial containing 5mL of methanol to be used as a blank solution. A small amount of the blank solution was injected into the gas chromatograph (Agilent technologies, 7820A, serial# CN12392019) using a Hamilton company syringe. After the solution was placed into the gas chromatograph, the start button on the front of the machine was pressed immediately to begin the analysis of the sample. A glass stopper was placed into the Erlenmeyer flask containing the solution and the flask was placed into a constant temperature bath set at 50 degrees Celsius for 10 minutes. During this time, 12 glass vials were taken and were labeled 1 through 12 and 5mL of methanol were added to each vial. After the 10 minutes, 1.7g of p-toluene sulfonic acid (Acros organics, 1-hydrate, Lot#B0050217) was added to the reaction flask. A .10mL aliquot was taken from the reaction flask immediately and placed into vial 1, the reaction flask was placed back into the constant temperature bath. The contents of vial 1 were then analyzed by the gas chromatograph. Every 5 minutes a .10mL sample was taken from the reaction flask and placed into the next labeled glass vial until vial #5 was reached at which point samples were taken from the flask every 10 minutes until all the glass vials have received an aliquot of the solution. All samples were analyzed by the gas chromatograph.
Data and Results:
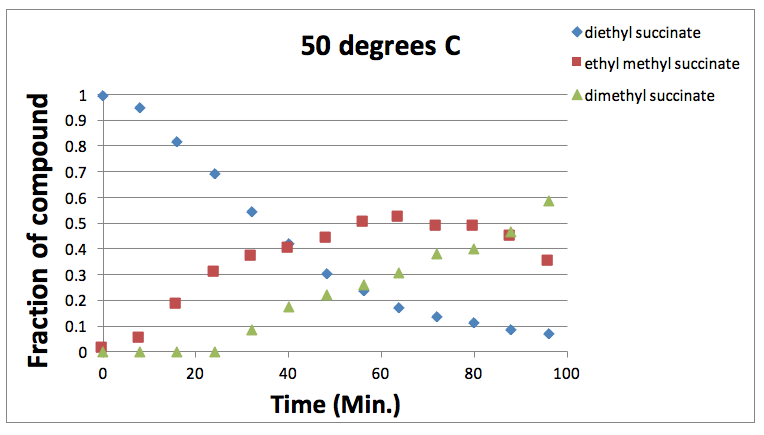
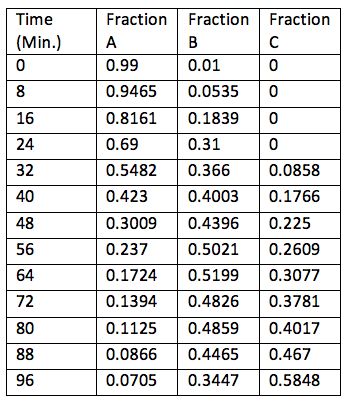
Figure 2: Graph showing the varying fraction of each component present at different times at 50 degrees Celsius
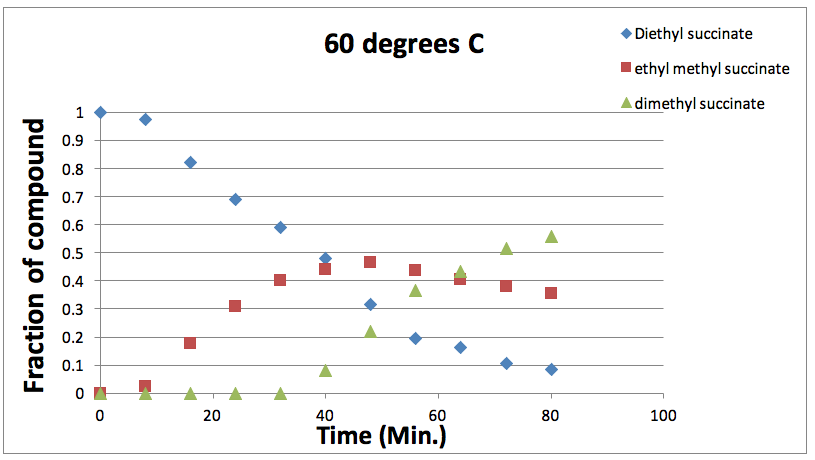
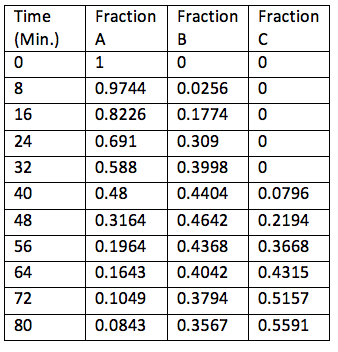
Figure 3: Graph showing the varying fraction of each component present at different times at 60 degrees Celsius
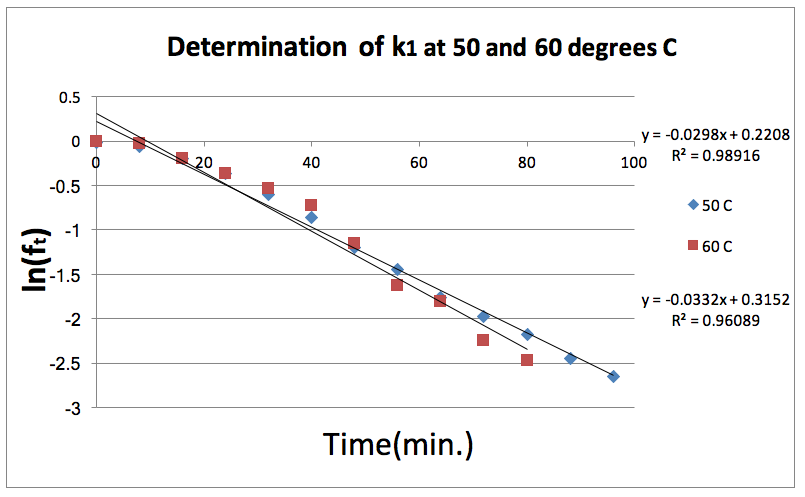
Figure 4: Natural log of the fraction of Diethyl Succinate is plotted against time at both 50 and 60 degrees Celsius. The slope of these lines gives the k1 for each temperature.
Appendix
50 degrees C (Used for Figure 2)
60 degrees C (Used for Figure 3)
(Used for Figure 4)