LDH assays – NADH absorption
Abstract
The Cary UV-Visible Spectrophotometer varian was used to measure both NAD+ and NADH absorption from 600 nm to 220 nm in a 1 cm quartz cuvette. The max wavelength for absorption for NAD+ was 259 nm and 338 nm for NADH. Using beer’s law and the dilution factor of 200, the concentration for NADHwas 1.06 X 10⁻⁴ M in the cuvette and 0.02 M in the undiluted sample, while the NAD+ had a concentration of 2.58 X 10⁻⁵ M in the cuvette and 0.006 M in the undiluted sample. The Amersham Biosciences Ultrospec 330 pro was used to find the absorbance at 595 nm for 9 different BSA standards. The absorbance versus concentration of BSA was then graphed to create a standard curve with a linear treadline of . This was used to find the unknown sample’s concentration from its absorption of 0.244. The sample had a concentration of 0.00684 μg/μl but because it was diluted 1000X, the original sample had a concentration of 6.84 μg/μl .
Introduction
Light is a wave that carries energy with it. The speed of light is constant, however the wavelength and frequency change. This gives each wave a different energy which can be described by the equation . This suggests the longer the wavelength is the less energy it carries. Molecules, atoms and ions all have the ability to absorb or reflect light, depending on the compound. For this reason a spectrophotometer is often used to help determine the unknown concentration of a substance. This knowledge can then be used to help determine the rate of formation or decomposition of a chemical reaction.
The way a spectrophotometer works is by shooting a beam of light at a certain wavelength (usually one that the chemical in question can absorb). This light then passes through a cuvette which contains a sample of the compound. The compound will then absorb a certain amount of the light, depending on the concentration. The higher the concentration is the higher the absorbance. The spectrophotometer then figures the difference between the light it gave out and the light that passed through the cuvette, to find out how much it absorbed1. The beer’s law , where A is the absorbance, ε is extinction coefficient, and l is the length of the cuvette, can then be used to determine the compound’s concentration.
Beer’s law by itself however can not determine concentration perfectly. With spectrophotometry a standard curve is created by graphing A vs known concentrations. A linear relationship is then created, and from it the unknown concentration of a sample can then be found1. In biochemistry this is often done using UV absorption, because the aromatic amino acids absorb at 280 nm, which allows for proteins to be studied without using a dye, especially non enzymatic proteins.
If a protein does not an aromatic amino acid, the dye coomassie brilliant blue G-250 is used to detect the concentrations of proteins. The dye is red and binds to the positive charges on a protein1. When this happens the dye turns blue. This process is called the Bradford method. In this lab the Bradford method and UV method to detect the concentrations of NAD+ and NADH.
Materials and Methods
Beers law for concentration
Place unknown concentration samples NADH and NAD+ on ice
Turn on UV and vis lamps in the spectrometer and select baseline correction.
Set baseline with a cuvette of water, scan from 600-220 nm.
Add 5 μl of NADH to the cuvette of water.
Scan and save data
Export data to ASCII format
Repeat steps for NAD+.
Standard curve
Set wavelength to 595 nm
Label 10 cuvettes 1-10
In tube 1 and 2 add 800 μl of water
In tubes 3-9 add water starting at 790 μl and decreasing by 10 μl each time
Add 200 μl of Bradford reagent to each cuvette
Add 0.2 mg/ml of BSA standard to tubes 3-9 starting at 10 μl and increasing by 10 μl each time
Add 100 μl of unknown concentration to 10 as well as 700 μl
Let cuvettes sit for 10 minutes then run the spectrometer
Graph a standard curve
Determine concentration of unknown sample
Results
To find the concentration of NADH and NAD+ a mixture of 95 μl DI water and 5 μl of unknown concentration of NADH or NAD+ was mixed in a quartz 1 cm cuvette. The absorptions were determined by the Cary UV-Visible Spectrophotometer (figure 1).
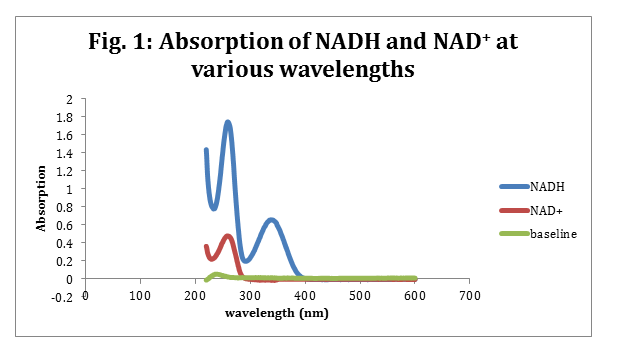
The max wavelengths for NADH was determined to be 338 nm with an absorption of 0.660 and NAD+ had a max wavelength at 259 nm with an absorption of 0.481. Beer’s law (eq. 1) was then used to determine the NADH and NAD+ concentration in the cuvette. The cuvette was 1 cm and the ε for NADH is 6220 M-1cm-1. The ε for NAD+ is 16900 M-1cm-1.2
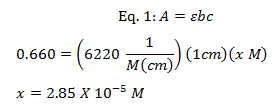
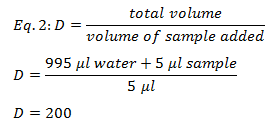
Because the NADH and NAD+ was diluted in the cuvette the original sample’s concentration was determined by multiplying the diluted molarity with the dilution factor. The dilution factor was 200X and was determined by using equation 2.
The final sample concentration for NADH was 0.02 M and the sample concentration for NAD+ was 0.006 M.
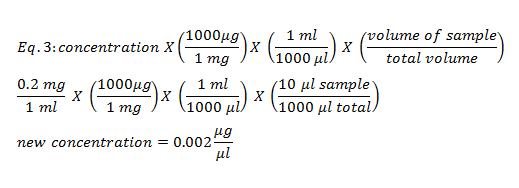
To determine the concentration of an unknown sample of BSA a standard curve was made using steps 3-7 in the methods. The total volume was 1000 μl. To determine the new concentration of each known sample equation 3 was used and recorded in table 1.
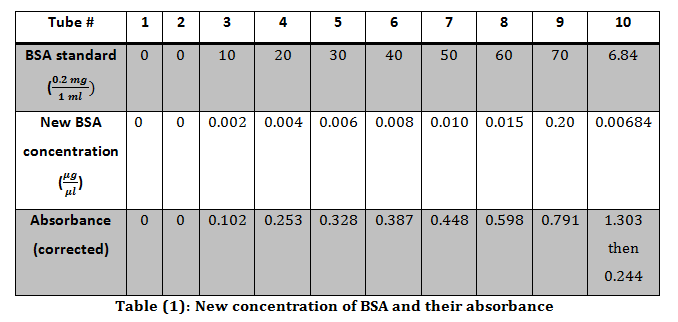
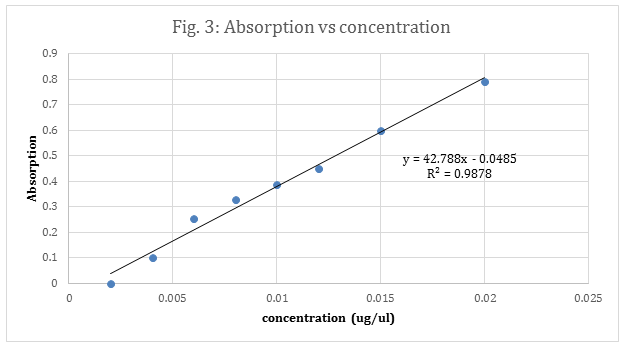
Each concentration was then plotted against their respective absorbance’s and the best fit line’s equation was.
The absorbance for the unknown BSA was originally 1.303, thus it was diluted by a factor of 10X. This was calculated using equation 2. Then 1 μl of the newly diluted unknown was used mixed with 99 μl of DI water and mixed with the Bradford reagent and water. This dilution was calculated to be 100X dilution using equation 2. The total dilution of the unknown was determined by multiply the two dilutions together (10 X 100) to get the final dilution of 1000X.
After the 1000X dilution the unknown’s absorbance was 0.244. This absorbance was plugged into the equation of the line, to solve for the concentration x.
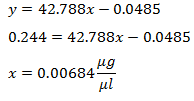
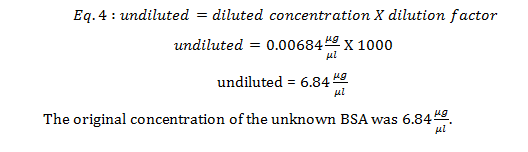
This is the concentration of the 1000X diluted unknown. To get the unknown’s original concentration, the diluted concentration was multiplied by the dilution factor (eq 4).
Discussion
NADH and NAD+ have both been studied and their extinct coefficient have both been determined. Both NADH and NAD+ have aromatic rings, which allow them to absorb light at 338 nm and 259 nm respectively. For this reason the UV/vis can be ran on just the NADH and NAD+ diluted with water. No Bradford agent is needed. Figure 1, shows the absorbance for NADH and NAD+ over a range of wavelengths. NADH has 2 major peaks, but the tallest overlaps with NAD+’s single peak. This suggests that NADH’s second peak is due to it being oxidized into NAD+. For this reason the peak at 338 nm was taken to be NADH’s maximum peak.
A surprising factor in figure 1 is that upon close inspection, the baseline is not a perfectly straight line. Few variations occur, which means that the water could have a slight containment that would absorb some of the light, or that the machine is not 100% perfect and will give a few variations in its reading. This is more plausible, because although our maximum wavelength for NAD+ was spot on for the given value of NAD+’s max wavelength, the NADH’s max wavelength was off by 2 nm.
For proteins that have few or do not have aromatic amino acids in them a plane UV/vis will not work. There will be no aromatic compounds to absorb wavelengths. When this occurs the Bradford agent is great for determining a unknown concentration, because it is negatively charge and will bind to a protein’s positively charged regions.2 When this occurs the dye turns from red to blue allowing the spectrometer to read the absorbance. Figure 1 is a standard curve using the Bradford agent to help measure a known BSA concentration’s absorbance. This standard curve then help determined the concentration of an unknown sample’s concentration. The sample’s absorbance was compared to figure 3, and the concentration was determined to be 0..
This concentration however is much lower than the original sample’s concentration. The original sample had to be diluted 1000X because without dilution, the sample’s absorbance is too large such that figure 3 does not include its absorbance in its range. With the dilution in hand it is then possible to measure the concentration of proteins that do not have an aromatic ring, and that have a high concentration.
The other reason why using the Bradford reagent method is more effective for measuring the concentration of proteins is because the Bradford reagent to make a standard curve does not require a protein’s extinct coefficient. Even if a protein has tons of aromatic amino acids, a UV/Vis can not determine a sample’s concentration. This is because beer’s law(eq 1) does not work without the extinct coefficient.
Literature cited
2Farrell, S. O., Taylor, L. E., Experiments in Biochemistry A hands-on approach, second edition, Brooks/Cole Cengage Learning: Belmont CA, 2006, 63-73.
