Measuring Mass of Yellow Dye and Sparkler’s Cations with Spectroscopy
Written by Hannah
Purpose
To measure the grams of yellow 5 dye in a sample (i.e. bottle of Minute Maid Lemonade), and to identify the cations present in sparklers using their emission spectra (Spectroscopy).
Procedure
Six standard solutions were made from the Yellow 6 stock solution. The first standard solution was made by adding 5.00 mL 6.550×10⁻⁵ M yellow 6 solution and 2.00 mL of distilled water to a test tube using a graduated pipet and by subsequently mixing them together. Standards 2-6 were made according to the volumes listed in Table 1. The sample used was already sufficiently diluted (its absorption as taken from the bottle was .553), so it was not diluted any further.
Table 1: Amounts of water and stock solution used to make standard solutions
| Standard # | mL of yellow 5 stock solution added | mL of distilled water added |
| 2 | 5.00 mL | 4.00 mL |
| 3 | 5.00 mL | 8.00 mL |
| 4 | 2.00 mL | 8.00 mL |
| 5 | 1.00 mL | 6.00 mL |
| 6 | 1.00 mL | 9.00 mL |
Data and Results
Table 2: Concentrations and absorptions at λ=428.3 nm for standard solutions/sample
| Solution | Concentration (M) | Absorption |
| Standard #1 | 4.679 x 10⁻⁵M | .914 |
| Standard #2 | 3.639 x 10⁻⁵ M | .704 |
| Standard #3 | 2.519 x 10⁻⁵ M | .457 |
| Standard #4 | 1.310 x 10⁻⁵ M | .243 |
| Standard #5 | 9.357 x 10⁻⁶ M | .186 |
| Standard #6 | 6.550 x 10⁻⁶ M | .103 |
| Sample | —— | .553 |
Graph 1: Concentration v. Absorption
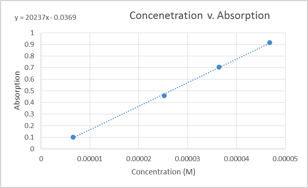
In the above graph, the data points for the 9.357×10⁻⁵ M and1.310×10-5M solutions were ommitted. This was due to the fact that the were slightly askew from the line formed by the other four data points and a more linear graph was produced when they were ommitted from it.
Beer’s Law obtained from graph:
A=ԑLC, where ԑL is the slope ԑL=20237 M-1
A=(20237 M-1)C
Sparkler Emissions
The first sparkler lit was green. Its emission spectrum is below.
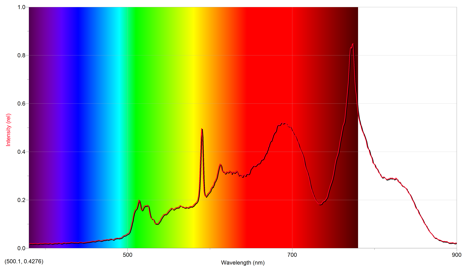
The above emission spectrum has a maximum intensity of .848 at 773.9 nm.
From the emissions of other cations, it appears that the emission spectrum of potassium most closely mimics the above spectrum, since they both have intensities around ~1 occurring at a wavelength of approximately 800 nm. However, this implies that the above emission spectrum is off, since the color of the sparkler was green. Potassium ions are a violet color, and copper ions are more of a bluish-green, so it seems that the more appropriate ion for the sparkler is copper even though the above spectrum suggests potassium.
The second sparkler lit was a reddish gold. Its emission spectrum is below.
 The above spectrum has a maximum intensity of .552 at 773.9 nm.
From the emission spectra of the other cations, it appears that the above emission spectrum most closely mimics that of lithium, as they both have similar intensities occuring at approximately the same wavelength. Since the flame seen was red, this makes sense. However, since the sparkler was gold, it seems there also should have been iron cations present, since they give off a gold color.
Calculations
Dilution 1:
C2=(C1V1)/V2=(6.550×10^-5 M * 5.00 mL)/(7.00 mL)=4.679×10^-5 M
Dilution 2:
C2=(C1V1)/V2=(6.550×10^-5M*5.00 mL)/(9.00 mL)=3.639×10^-5 M
Dilution 3:
C2=(C1V1)/V2=(6.550×10^-5 M *5.00 mL)/(13.00 mL)=2.519×10^-5 M
Dilution 4:
C2=(C1V1)/V2=(6.550×10^-5 M *2.00 mL)/(10.00 mL)=1.310×10^-5 M
Dilution 5:
C2=(C1V1)/V2=(6.550×10^-5 M *1.00 mL)/(7.00 mL)=9.358×10^-6 M
Dilution 6:
C2=(C1V1)/V2=(6.550×10^-5 M *1.00mL)/(10.00 mL)=6.550×10^-6 M
Concentration of yellow 6 in sample:
A=ԑLC
C=A/ԑL=(.553)/(20237 M-1)=2.733×10⁻⁵M
The mass of yellow 6 in the bottle of Minute Maid Lemonade was therefore,
.591 L(.00002733 mole/1L)=1.615×10-5 mole
1.615×10⁻⁵ mole (534.37 g/1 mole)=.00863 grams yellow 5/bottle
Discussion
Standards were created by starting off with the stock Yellow 5 solution and then making various dilutions from it such that data points ranging from .1 to 1 were achieved. Dilutions were carried out using a graduated pipet. From measuring the standards, a Beer’s Law equation of A=(20237 M-1)C was obtained. Considering that the dilutions were made using pipets that were only significant to 2 decimal places, and that there was probably some human error when making the dilutions, this equation may not be as accurate as it could have been using more precise measurement techniques. Two of the standard data points were dropped because they strayed from the linear relationship dictated by the other 4 data points, suggesting that there was some error. From Beer’s Law, the mass of Yellow 5 in the Minute Maid Lemonade bottle came to be .00853 grams, which seems like a reasonable amount.
It seemed that the emission spectra obtained were slightly off. Observations of the green sparkler suggested that a cation that produces a green flame was in it. However, from comparing the spectra to the pre-known emissions spectrum of the other ions, potassium matched it the most closely. In actuality, it should have been barium or copper ions since they both produce green flames. For the gold sparkler, a reddish flame was observed, and from comparing the emission spectra, it makes sense that lithium most closely matches the emission spectrum obtained. However, considering that it was supposed to be a gold sparkler, and that iron ions are associated with gold sparks/flames, it seems that those ions should have been in the sparkler too.
Post Lab Questions
1 Calibration involved putting a curvet with water into the spectrometer. Since the absorbance of water is 0, this made sure that the spectrometer is set to the “correct” 0. This helped ensure that the later measurements of the standards and sample were accurate. For example, if the spectrometer was not calibrated and it gave the absorption of water to be .1 (when it is clearly 0), this could impact the measurements of the standards/sample, give higher absorbances than they actually have, and then skew the results obtained from Beer’s Law.
2 When the absorbance is larger than 1.0 the graph begins to “plateau” (i.e. it levels off, instead of increasing at the same rate it previously was). 1.0 is the max because absorbance is giving by a logarithmic equation, such that when the absorbance is equal to 1, it means that the solution is absorbing ~90% of the light upon it. For a solution to have an absorbance greater than 1, it means that the solution is slowly approaching absorbing 100% of the light upon it. Because of this, the graph does not go to infinity, and instead levels off.
3 Green would be the expected color. This is because nonmetallic ions do not give off visible light when the compound is burned. This is supported by the above observations; potassium gives off a purple color, so the fact that the potassium gluconate also gave off a purple color supports the idea that the gluconate is not contributing to the color. By that same rational, the copper(II) gluconate should have a green flame.
4.
a. Although copper salts give off a blue color, it reacts with one of the oxidizing agents commonly used in fireworks (potassium chlorate) to form a compound that is very explosive and therefore very difficult to safely store.
b. A yellow color is emitted when compounds containing carbon are burned. Consequently, this can skew and dull the intended color of the fireworks.
c. White fireworks are the result of magnesium and aluminum; gold sparks are the result of iron; and white sparks are the result of aluminum, magnesium, aluminum-magnesium alloy, and titanium.
