Concentration of Nitrate Ions and Chlorine Ions in Wastewater
Concentration of Nitrate Ions and Chlorine Ions in Wastewater
By: Jenny Mathe
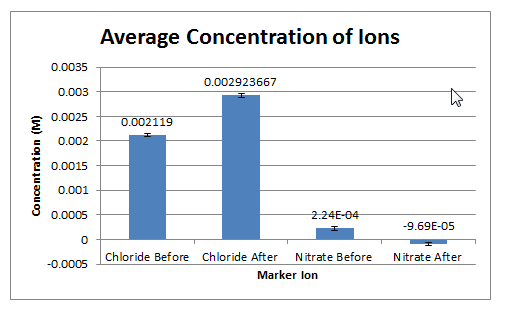
Abstract: An experiment was conducted in order to test the concentration of ions in wastewater that is being deposited into Lake Onondaga. Ions, such as NO3– and Cl– can pollute the water by stimulating algal growth and remove phosphate from the water, respectively. The experiment consisted of testing the both the nitrate and chloride ion through spectrometry and titration in order to determine the concentration of the ion before and after treatment. With the titration, chloride ion concentration was determined to be an average of 0.00211 M before treatment and an average of 0.00292 M after treatment. In the spectrometry, the nitrate ion concentration was determined to an average of 2.24×10⁻⁴ M before treatment and an average of -9.69×10⁻⁵ M. The results indicate that after treatment, the levels of chloride ion increase slight, whereas the nitrate ion decrease significantly, which allows for less algal growth in the lake and more oxygen for the survival of other organisms.
Procedure Part One: In order to determine the concentration of chloride ion, titration was used. 25.0 mL of wastewater was added to three Erlenmeyer flask using a 25.0 mL volumetric pipette. The 25.0 mL of wastewater was diluted with 25.0 mL of deionized water that was measured using a graduated cylinder. Three drops of yellow K2CrO4 indicator was added to each of the Erlenmeyer flasks. The burette was set up on a double clamp and was filled with 0.0100 M AgNO3 solution. A small amount of AgNO3 was drained out of the burette in order to fill the tip and clear air. An initial reading of volume was taken and recorded and the AgNO3 solution was slowly added to the Erlenmeyer flask with the wastewater. While the AgNO3 solution was added, the flask was swirled. The endpoint was reached when the solution in the Erlenmeyer flask turned a cloudy orange color. A final volume reading was taken and recorded and by subtracting the final volume from the initial volume, the total volume was found and recorded. This process was repeated two more times from the point of recording the initial volume. The solutions were disposed of in a waste bottle and leftover AgNO3 solution was placed in a recycling bottle.
Procedure Part Two: With finding the nitrate ion concentration, spectrometry was used. To begin, a micropipette was practiced with in order to be successfully used in preparing solutions to test with spectrometry. A row of four test tubes was set up in a test tube rack and labeled with the numbers one through four. A small Erlenmeyer flask, which would be used as a stand for the test tube, was weighed on a balance and its mass was recorded. The first test tube was added to the Erlenmeyer flask and weighed and recorded. This process was repeated for the next three test tubes. The mass of the test tubes was recorded by taking the mass of the test tube and Erlenmeyer flask and subtracting the mass of Erlenmeyer flask. Next, a 1000 microliter pipette was obtained and deionized water was dispensed into each of the four test tubes. 250 microliters was added to the first test tube. 500 microliters was added to the second test tube. 1000 microliters was added to the third test tube and 2000 microliters was added to the fourth test tube. The test tubes were weighed once again, using the small Erlenmeyer flask as a stand and the final mass of the test tube and water was recorded by subtracting the mass of the Erlenmeyer flask from the final mass of the Erlenmeyer flask, test tube, and water. The mass of water was then calculated by subtracting the mass of the test tube from the mass of the test tube and water. The actual mass of the water was compared to the predicted mass of the water which was calculated using the density of water (1g/1ml). Next, the nitrate ion determination began by setting up nine labeled test tubes in a test tube rack. To the first test tube, 1000 microliters of deionized water was added for a blank. To the second test tube, 100 microliters of nitrate standard and 900 microliters of deionized water were added. To the third test tube, 250 microliters of nitrate standard and 750 microliters of deionized water were added. To the fourth test tube, 500 microliters of nitrate standard and 500 microliters of deionized water were added. To the fifth test tube, 750 microliters of nitrate standard and 250 microliters of deionized water were added. To the sixth test tube, 1000 microliters of nitrate standard were added. To the seventh, eighth and ninth test tubes, 500 microliters of wastewater and 500 microliters of deionized water were added. Next, to all of the test tubes, 1000 microliters of mixed acid reagent and approximately 0.05 grams of Nitrate reducing reagent were added. Each test tube was then stirred for approximately ten seconds using a stirring rod, with the stirring rod being rinsed with deionized water and dried with a Kimwipe in between each test tube. The test tubes were allowed to stand for seven minutes to allow for the colors to develop. After seven minutes, the spectrometer was set at 540 nm and the absorbance of each test tube was taken and recorded, starting with the blank. The solutions were disposed of in a waste bottle.
Results Part One: Chloride Ion Determination
The chloride ion concentration was determined by titration. Three trials were used to calculate the molarity of the chloride ion in the wastewater. Before and after treatment concentration of chloride ion can be seen in the table below. The first three columns illustrate the volume of AgNO3 used in the titration. From the volume of AgNO3, the moles of AgNO3 used was calculated using dimensional analysis (See below) using the 0.0100 molarity of AgNO3 which can be multiplied by the volume (in liters) of the AgNO3 used. The moles of silver ion shown in the fourth column was calculated (See below) using the mole to mole ratio determined with the balanced ionic equation (Ag+ + NO3– àAgNO3). In the fifth column, the moles of chloride ion was calculated (See below) using the balanced ion equation (Ag+ + Cl– àAgCl) and the mole to mole ratio. In the sixth column, the molarity of chloride ion was determined by dividing the moles determined in the fifth column by .025 L, which is the sample volume in liters.
Before Treatment *All calculations are averaged
|
Vol. of AgNO3 used (Trial 1) |
Vol. of AgNO3 used (Trial 2) |
Vol. of AgNO3 used (Trial 2) |
Moles of AgNO3 | Moles of Ag+ | Moles of Cl– | Molarity of Cl– |
|
5.11 mL |
5.10 mL |
4.99 mL |
5.067×10⁻⁵ | 5.067×10⁻⁵ | 5.067×10⁻⁵ | 0.00202 M |
|
5.00 mL |
6.01 mL |
5.40 mL |
5.47×10⁻⁵ | 5.47×10⁻⁵ | 5.47×10⁻⁵ | 0.00219 M |
|
5.51 mL |
4.84 mL |
5.71 mL |
5.35×10⁻⁵ | 5.35×10⁻⁵ | 5.35×10⁻⁵ | 0.00214 M |
|
5.07 mL |
5.83 mL |
5.00 mL |
5.30×10⁻⁵ | 5.30×10⁻⁵ | 5.30×10⁻⁵ | 0.00212 M |
After Treatment *All calculations are averaged
|
Vol. of AgNO3 used (Trial 1) |
Vol. of AgNO3 used (Trial 2) |
Vol. of AgNO3 used (Trial 2) |
Moles of AgNO3 | Moles of Ag+ | Moles of Cl– | Molarity of Cl– |
|
7.28 mL |
7.00 mL |
7.32 mL |
7.20×10⁻⁵ | 7.20×10⁻⁵ | 7.20×10⁻⁵ | 0.00288 M |
|
8.20 mL |
6.60 mL |
6.65 mL |
7.15×10⁻⁵ | 7.15×10⁻⁵ | 7.15×10⁻⁵ | 0.00286 M |
|
6.70 mL |
8.40 mL |
8.00 mL |
7.70×10⁻⁵ | 7.70×10⁻⁵ | 7.70×10⁻⁵ | 0.00308 M |
|
7.02 mL |
6.70 mL |
7.84 mL |
7.17×10⁻⁵ | 7.17×10⁻⁵ | 7.17×10⁻⁵ | 0.00287 M |
Own Data
| Table(After Treatment) |
Trial 1 |
Trial 2 |
Trial 3 |
| Initial Volume |
17.69 mL |
25.31 mL |
32.01mL |
| Final Volume |
24.71 mL |
32.01 mL |
39.85 mL |
| Total Volume |
7.02 mL |
6.70 mL |
7.84 mL |
| Moles of AgNO3 used |
7.02×10⁻⁵ |
6.70×10⁻⁵ |
7.84×10⁻⁵ |
| Moles of Ag+ used |
7.02×10⁻⁵ |
6.70×10⁻⁵ |
7.84×10⁻⁵ |
| Moles of Cl– used |
7.02×10⁻⁵ |
6.70×10⁻⁵ |
7.84×10⁻⁵ |
| Volume of DI Water |
25.00 mL |
25.00 mL |
25.00 mL |
| Molarity of Cl– |
0.0028 M |
0.0027 M |
0.0031 M |
Sample Calculations
Moles of AgNO3
Moles of Ag+
Moles of Cl–
Molarity of Cl–
Results Part Two: Nitrate Ion Determination
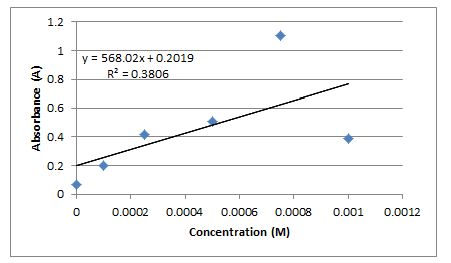
Nitrate ion concentration was determined using spectrometry and a calibration curve. Three test tubes were filled with 500 microliters of wastewater and 500 microliters of deionized water. These test tubes were then placed in the spectrometer and their absorbance at 540 nm was recorded. The absorbance values for each of the three test tubes can be seen in the before and after treatment tables below. The concentration of the nitrate ion in each solution was determined using Beer’s Law and a calibration curve comparing concentration and absorbance determined from the graphing tool on Excel. The graph generated a best fit line according to the data taken from the known concentrations of nitrate as seen in own data below. From the line in the form y=mx+b, Beer’s Law (A=Ɛ/c where / is 1) was applied by replacing y with the absorbance gathered using the spectrometer, m with Ɛ, / remaining one, and c being solved for, along with a correction factor as b (See below). After c, was calculated using Beer’s law, the concentration was doubled because the original sample of wastewater was diluted by 50%. Also, concentration of the nitrate ion in samples one through 6 was calculated using the equation C1V1=C2 V2 in which the C1 equals the known concentration of pure nitrate standard (1.00×10⁻³ used in this experiment), V1 equals the volume of nitrate in a test tube, V2 equals the total volume of 1000 microliters in this case, and C2 is being solved for (See Below).
Before Treatment *All calculations are averaged
|
Absorbance of Water Sample 1(A) |
Absorbance of Water Sample 2(A) |
Absorbance of Water Sample 3(A) |
Concentration of NO3– |
|
0.226 |
0.237 |
0.333 |
3.30×10⁻⁴ |
|
0.295 |
0.275 |
0.311 |
2.93×10⁻⁵ |
|
0.420 |
0.223 |
0.352 |
2.74×10⁻⁴ |
|
0.232 |
0.216 |
0.360 |
2.60×10⁻⁴ |
After Treatment *All Calculations are averaged
|
Absorbance of Water Sample 1(A) |
Absorbance of Water Sample 2(A) |
Absorbance of Water Sample 3(A) |
Concentration of NO3– |
|
0.093 |
0.099 |
0.105 |
-1.80×10⁻⁴ |
|
0.020 |
0.032 |
0.038 |
-2.93×10⁻⁴ |
|
0.132 |
0.115 |
0.099 |
5.72×10⁻⁵ |
|
0.042 |
0.044 |
0.051 |
-4.15×10⁻⁵ |
|
0.060 |
0.060 |
0.060 |
-2.58×10⁻⁵ |
Own Data
| Test Tube | Volume of Nitrate Standard | Volume of DI Water | Nitrate Concentration | Absorbance (A) |
| 1 | 0 µL | 1000 µL | 0.00 M | 0.069 |
| 2 | 100 µL | 900 µL | 1.00×10⁻⁴ M | 0.203 |
| 3 | 250 µL | 750 µL | 2.50×10⁻⁴ M | 0.416 |
| 4 | 500 µL | 500 µL | 5.00×10⁻⁴ M | 0.505 |
| 5 | 750 µL | 250 µL | 7.50×10⁻⁴ M | 1.105 |
| 6 | 1000 µL | 0 µL | 1.00×10⁻³ M | 0.390 |
| 7 | 500 µL | 500 µL | -3.83×10⁻⁴ M | 0.093 |
| 8 | 500 µL | 500 µL | -3.62×10⁻⁴ M | 0.099 |
| 9 | 500 µL | 500 µL | -3.41×10⁻⁴ M | 0.105 |
Calibration Curve/ Plot of Section-Wide Data
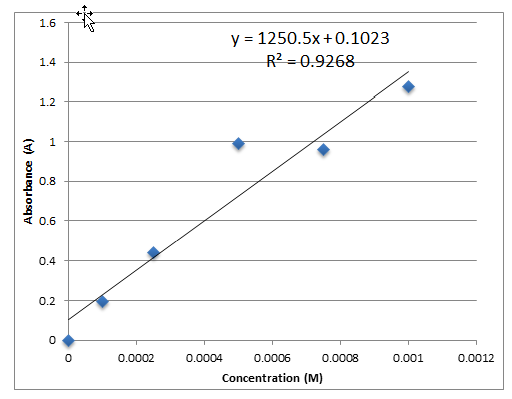
Calibration Curve/ Plot for Own Data
Sample Calculations
Concentration of Nitrate Standard in Test Tubes 1-6
Concentration of Nitrate Ion in Wastewater using Beer’s Law
Section-Wide Column Chart of Before and After Treatment Concentration Averages
Discussion:
- Analytical tests were performed to test the concentrations of chloride and nitrate ions in wastewater before and after treatment. For determining the concentration of chloride ion, titration was used to measure the volume of AgNO3 to carry out a reaction between Ag+ and Cl–, so that all of the Cl– was used up. After the Cl– combined with Ag+, the Ag+ combined with CrO4-2 to create a cloudy orange color, indicating the end of the reaction. The volume of AgNO3 used was measured and moles of AgNO3, Ag+, and Cl– were calculated, allowing for molarity (moles/liters) to be calculated. For determining the concentration of the nitrate ion, spectrometry and a calibration curve was used. The spectrometry gave the data for concentration of nitrate ion compared to the absorbance. Using the data gathered from the spectrometry, the concentration and absorbance was plotted using a graphing tool and a best fit line equation was determined. The absorbance of the wastewater was used with the equation and Beer’s Law to determine the concentration of the nitrate ion in the wastewater. From a chemical perspective, the determination of the chloride ion was more experimental in that a chemical process was used to determine concentration, whereas the determination of the concentration of the nitrate ion was more analytical because it was based on a best fit line equation.
- The water treatment method seems to be positive in reducing the concentration of nitrate ion in the wastewater, although there may be error due to the use of a best-fit equation rather than true experimental data. The concentration of nitrate ion reduced from a concentration of 2.23×10⁻⁴ M with before treatment to below zero at -9.66×10⁻⁵ M, although there is error with the concentration in the after treatment, as concentration cannot be below zero. The concentration of nitrate ion after treatment is relatively close to zero and therefore, could be assumed to be zero molarity. For the chloride ion, the treatment method is a positive method because the concentration has increased from 0.00212 M with before treatment to 0.00292 M with after treatment. The increase in chloride ion indicates the use of Iron (III) Chloride in water treatment. The Iron (III) Chloride is used remove harmful phosphate for the water and exists in a single displacement reaction, leaving chloride ion as a product, thus increasing concentration. Based on the data, the water treatment method is effective in reducing the concentration of nitrate ion and phosphate in the water with the repercussion of increases chloride ion.
- Sources of nitrogen in wastewater are mainly associated with humans. Humans ingest nitrogen which is present in mainly food and in turn, humans digest the nitrogen and expel it. Fecal matter and urine is a heavy source of nitrogen and when deposited into a toilet, it becomes incorporated into wastewater. According to Dr. Peggy Minnis, for every 120 g of fecal matter, or the approximate daily human excrement amount, there is 1.2 grams of nitrogen and for every 1.1 liter of urine; there is 11 grams of nitrogen. Much nitrogen comes from excrement from the human body, which amounts for 200 mg per liter concentration in wastewater. The nitrogen from the waste reacts with other chemicals present in the wastewater and yields nitrate ions. Chloride in the wastewater is also mainly attributed to human activity. The main source of chloride is self-regenerating water softeners which produce 7,700 pounds of chloride per day. Other sources attributed by human activity include human waste, yielding 1,700 pounds per day, laundry at 1,3600 pounds per day, cleaning activities at 165 pounds per day, and swimming pool filter backwash at 110 pounds per day.
“Santa Clarita Valley Joint Sewerage System Chloride Source Report .” Sterling Water Systems . N.p., Oct. 2002. Web. 31 Oct. 2012. <http://www.sterlingwatersystems.com/documents/Chloride_Report.pdf>.
Minnis, Peggy. “Sources of Nutrients in Wastewater.” NC State University Cooperative Extension. N.p., n.d. Web. 31 Oct. 2012. <http://www.ces.ncsu.edu/plymouth/septic3/MinnisNutrientsText.pdf>.
- The wastewater before and after treatment is safe for drinking, according to EPA guidelines. Before treatment, the concentration of nitrate ion is 0.000223 M and after treatment, the concentration is -0.0000966 M, or zero concentration. The EPA requires nitrate concentration to be below 0.0071 M for safe drinking, and therefore the wastewater is safe to drink, according to nitrate levels only as the concentration before and after is lower than 0.0071 M.
- Lake Onondaga, the release point of Metro’s seepage, does not contain safe drinking water. Although, according to EPA standards that the concentration levels of nitrate must be below 7.1×10⁻³ M, which the wastewater does meet, much of the lake still contains high levels of nitrate in the water from previous seepage. Additionally, according to Onondaga Lake Partnership, the levels of ammonia in the lake are quite high, requiring a year-long nitrification process in the wastewater, which converts the ammonia into nitrate. Therefore, the nitrate levels of lake are far higher than the levels in the wastewater, making the water unsafe for drinking.
“Cleanup: Municipal Wastewater .” Onondaga Lake Partnership . N.p., n.d. Web. 31 Oct. 2012. <http://www.onlakepartners.org/cleanup_municipal>.
Conclusion: As a whole, this experiment was able to determine the concentration of both nitrate and chloride ions in wastewater, before and after treatment at a waste plant. Titration was used to chemically analyze a sample of wastewater, before and after treatment, and the concentration was able to be found using mathematics. Spectrometry was used to mathematically analyze the concentration of nitrate ion in wastewater, before and after treatment. Known concentrations of nitrate ion had their absorbance measured and plotted and a best fit line equation was determined. The nitrate concentration of wastewater was determined by mathematically determined by inserting the absorbance values measured for the wastewater into the equation and solving for the concentration. Using the concentrations before and after treatment, the final treatment of Metro can be analyzed in its effectiveness. For the chloride ion, the concentration seems to be increasing from before to after treatment and for the nitrate ion, the concentration decreasing significantly from before to after treatment. Metro should not employ further treatment strategies because the ion concentrations are at a level that is not hazardous, and maybe beneficial, to the lake. The nitrate concentrations after treatment are below zero, perhaps due to error, suggesting that the concentration of nitrate in the wastewater is non-existent. Because the concentration of the nitrate ion was determined graphically, there was error as the best fit line equation did not match completely with the data. Therefore, the nitrate ion concentration data is slightly inaccurate, but the general pattern of the decrease in nitrate concentration is valid. The nitrate ion was of most concern because it promotes algal growth which uses up the oxygen in the lake, rendering it incapable of sustaining life. The chloride concentration increasing from before to after treatment, meaning that Metro is using Iron(III) Chloride to remove phosphate from the water, thus leaving chloride ion as a product, increasing the concentration level. Although Metro has contributed largely to the failing health of Onondaga Lake in past years, the treatment plant has reformed its way and is implementing safer treatment of water by lowering the nitrate levels in its effluent, thus allowing the lake to be able to sustain life once again.
