Solution Density and Partial Molar Volume as Functions of Concentration
Solution Density and Partial Molar Volume as Functions of Concentration
By: Melissa Michaels
Abstract
A simple NaCl solution was used to model densities of solutions versus the molality of that solution. This simple solution was then done with organic solutions including methanol, 1-propanol, and 2-propanol. Using the derivative of the slope when plotting density versus molality we were able to show the partial molar volumes of the solutions.
1. Introduction
The purpose of this experiment was to demonstrate the differences in solution density and partial molar volume in regards to the concentration of the solute. The theory behind this experiment rests on the following:
where Vsolution is the total volume, Vh20 and V NaCI is the partial molar volume of each component in the solution, and and is the number of moles of each component. The partial volumes are measure at a constant temperature (T), pressure (P), and number of moles (n). The change of the solution volume with the addition of n moles of NaCl to water can be found using:
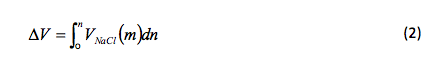
where n is the total number of moles added and V NaCl(m) is the partial molar volume as a function molality. Molality can be found by
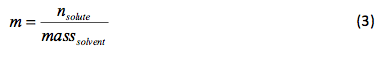
where n solute is measured in moles and the mass solvent is measured in kilograms.
2. Experimental Method
The procedures for both experiments were provided by the instructor with a few variations. Rather than each group preparing six 500ml solutions when finding the density of NaCl in water, only one stock solution was made for each of the six concentrations and each group used those stock solutions. We were then able to use a 50ml volumetric flask to weigh and find the density. The grams of NaCl given for each solution were halved due to the fact that they were given in grams NaCl/L and we were working with 0.5L. When conducting the same experiment using methanol as our solute we calculated the molality without using a weighing bottle only the 25ml flask. We also added data for 0ml of the solvent and 25ml of the solvent and we did not measure the refractive index of the solutions.
3. Results
For the NaCl solution the experimental data is presented in Table 1
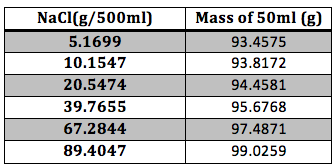
Table 1 Experimental Results: The mass of the NaCl and of the final solution were taken with an analytical balance.
The calculated date is presented in Table 2
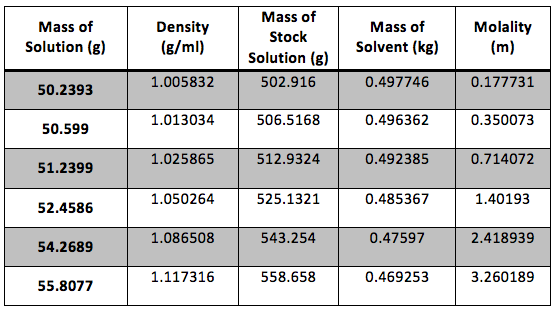
Table 2 Calculated Results: The dry weight of our flask was 43.22g and the true volume was 49.948 ml. Sample calculations are shown in Appendix 1.
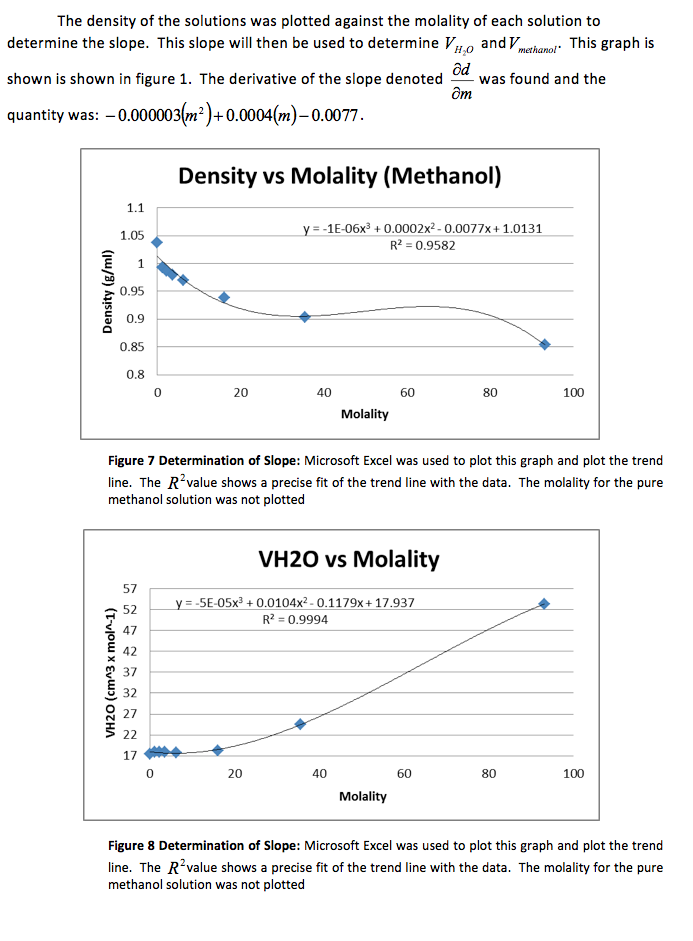
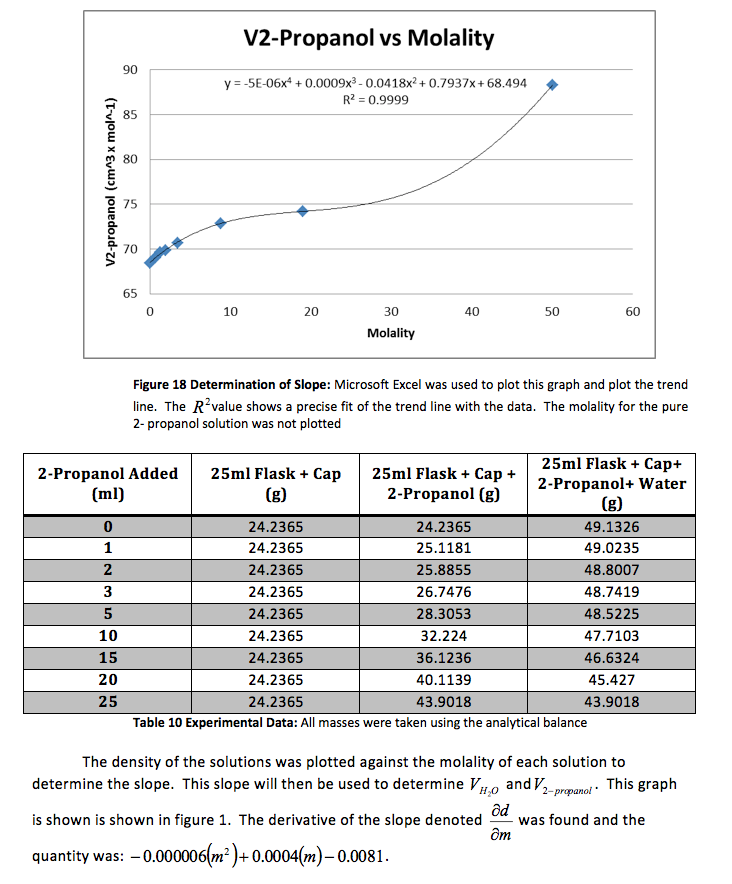
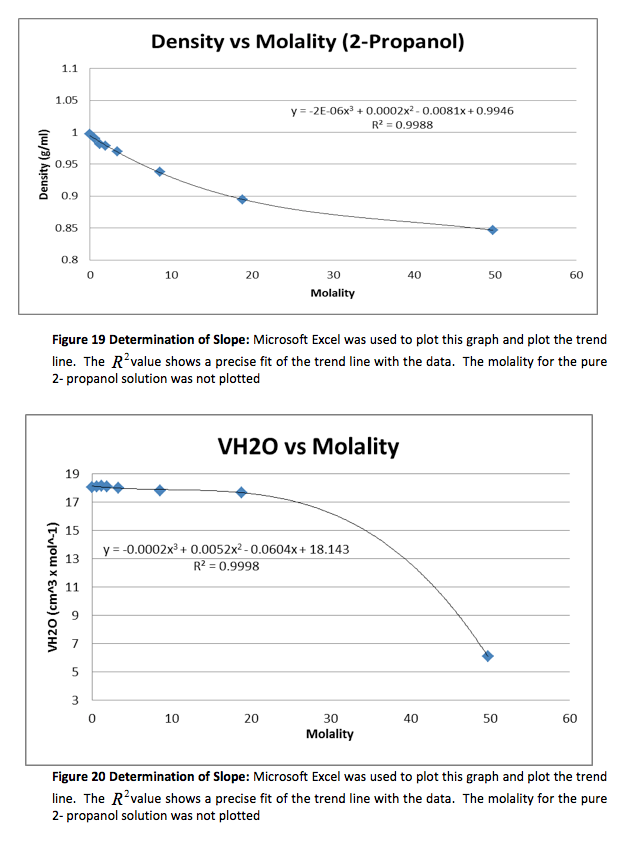
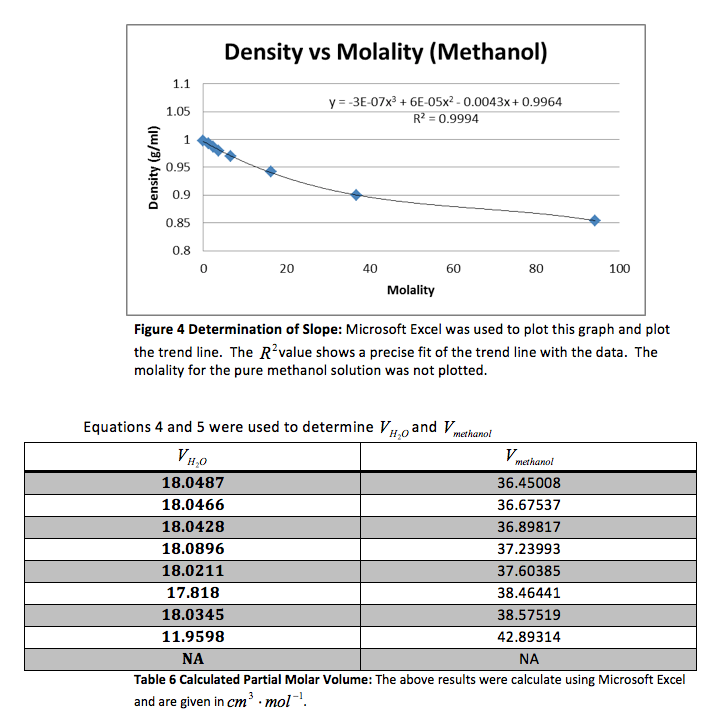
The density of the solutions was plotted against the molality of each solution to determine the slope. This slope will then be used to determine V H20 and V NaCL.
This graph is shown is shown in figure 1. The derivative of the slope denoted

was found and the quantity was:
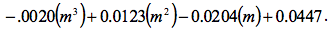
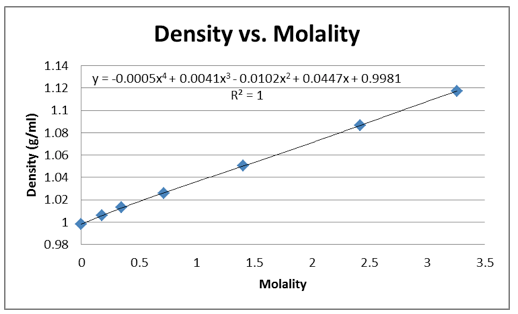
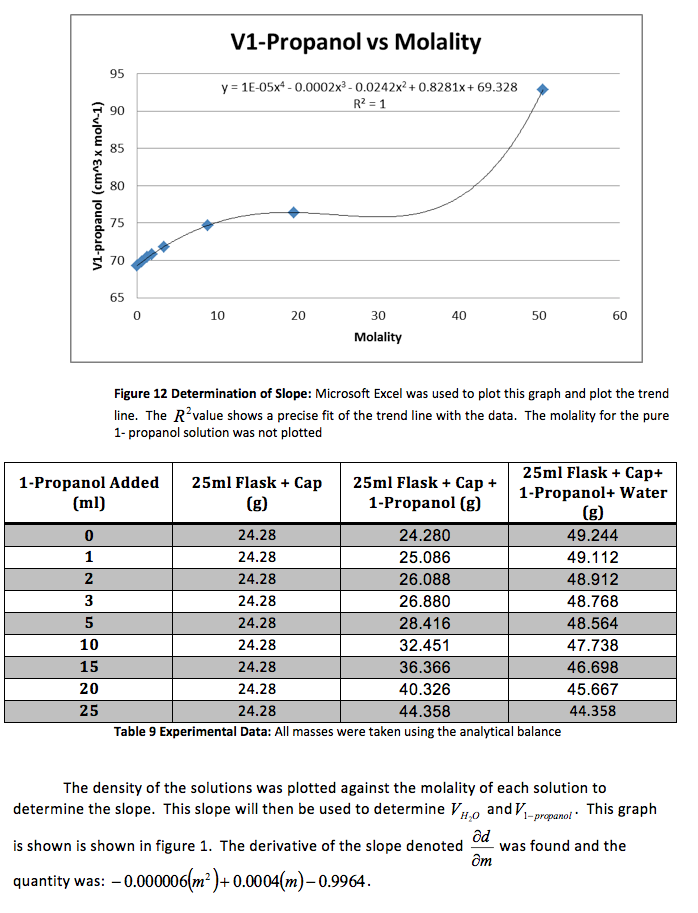
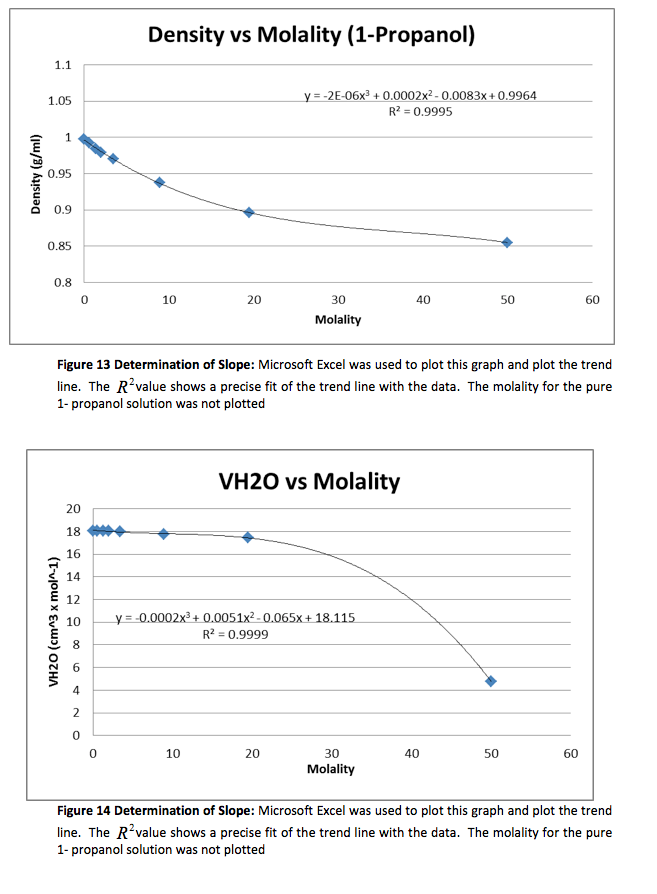
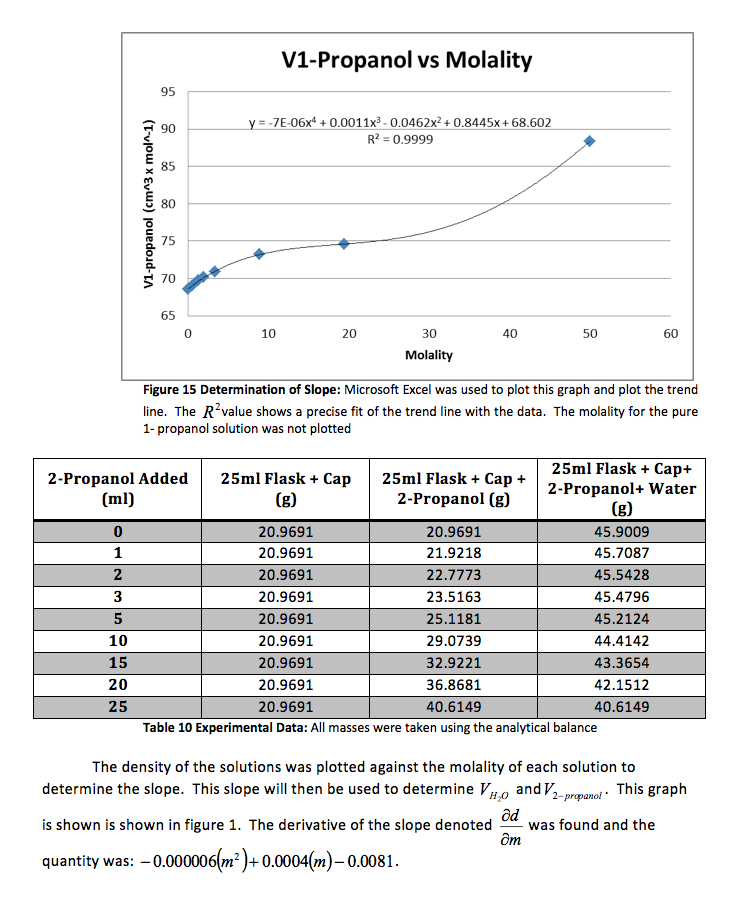
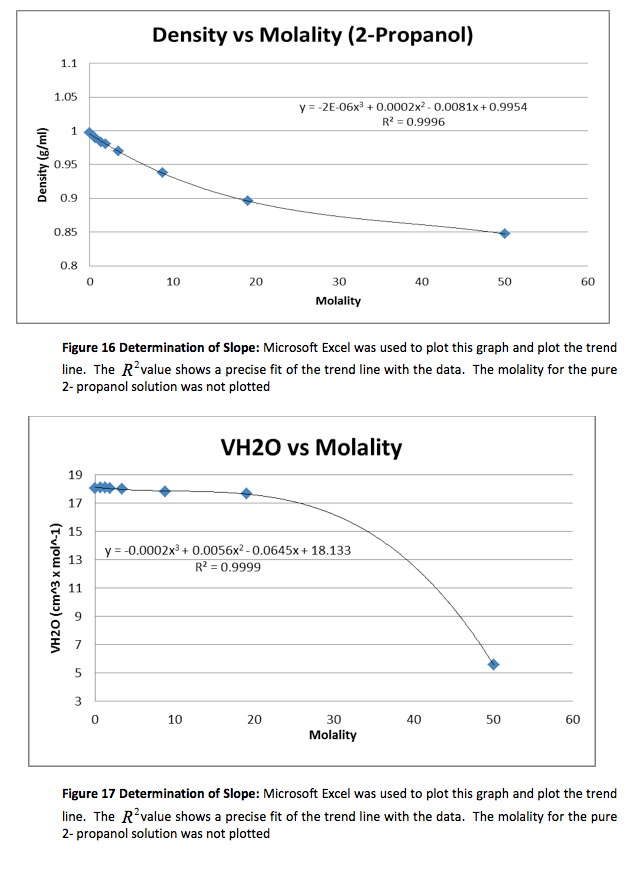
Figure 1 Determination of Slope: Microsoft Excel was used to plot this graph and plot the trend line. The value shows a precise fit of the trend line with the data.
That slope was used to determine and , the partial molar volumes, using the following formulas.
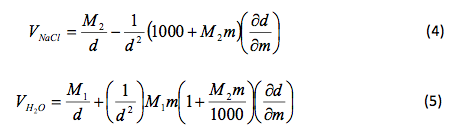
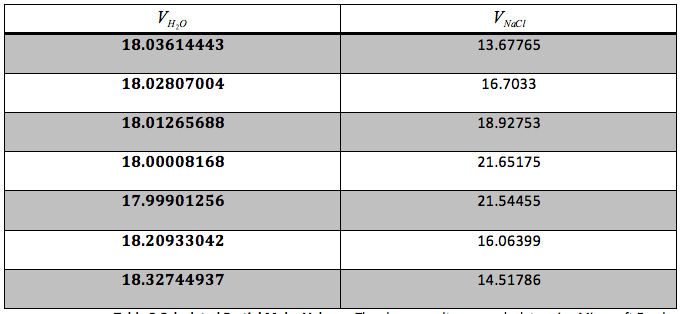
Table 3 Calculated Partial Molar Volume: The above results were calculate using Microsoft Excel and are given in

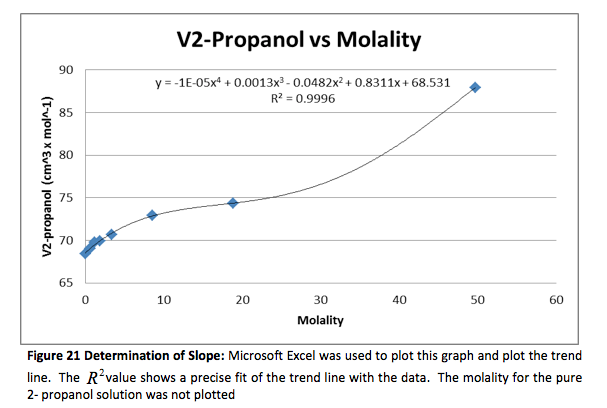
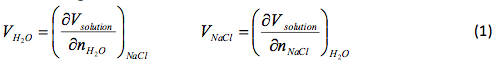
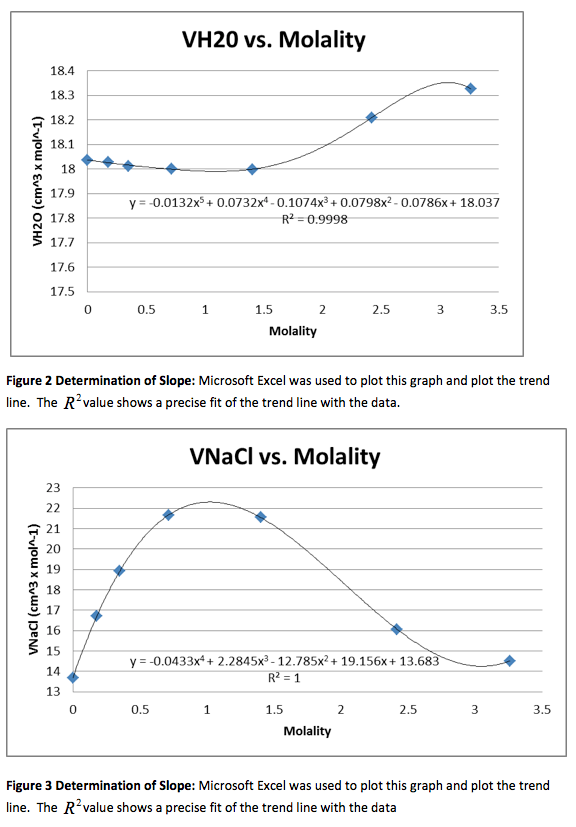
We were also instructed to graph the partial molar volume against the molality of the solution
Results for the Organic Solvents
Methanol:
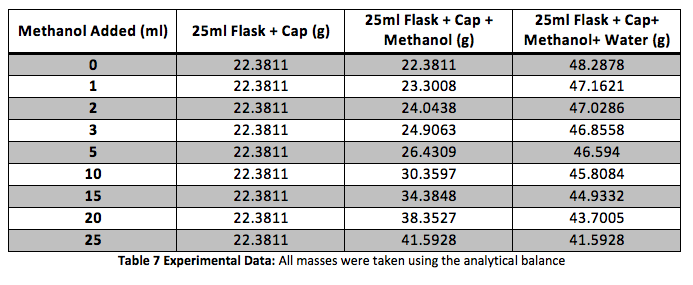
Our group did the experiment with methanol and received the following data.
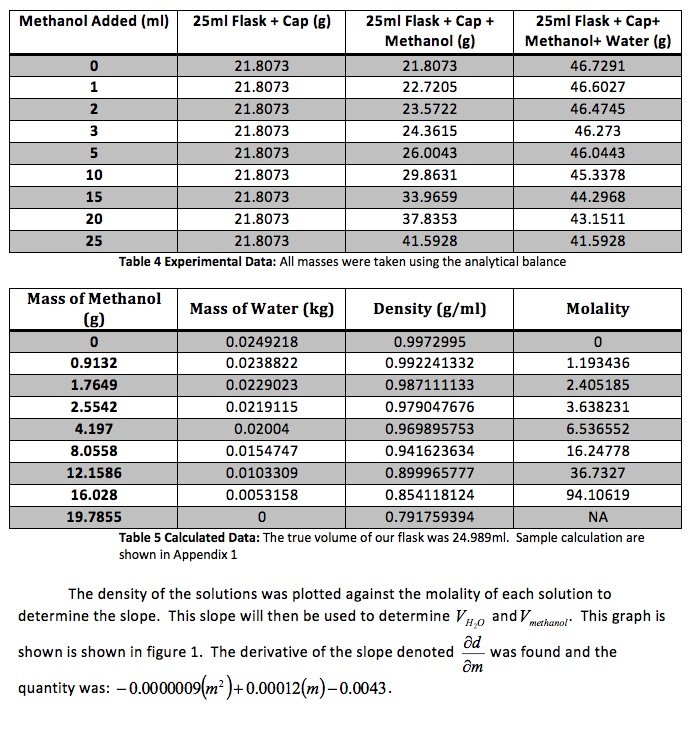
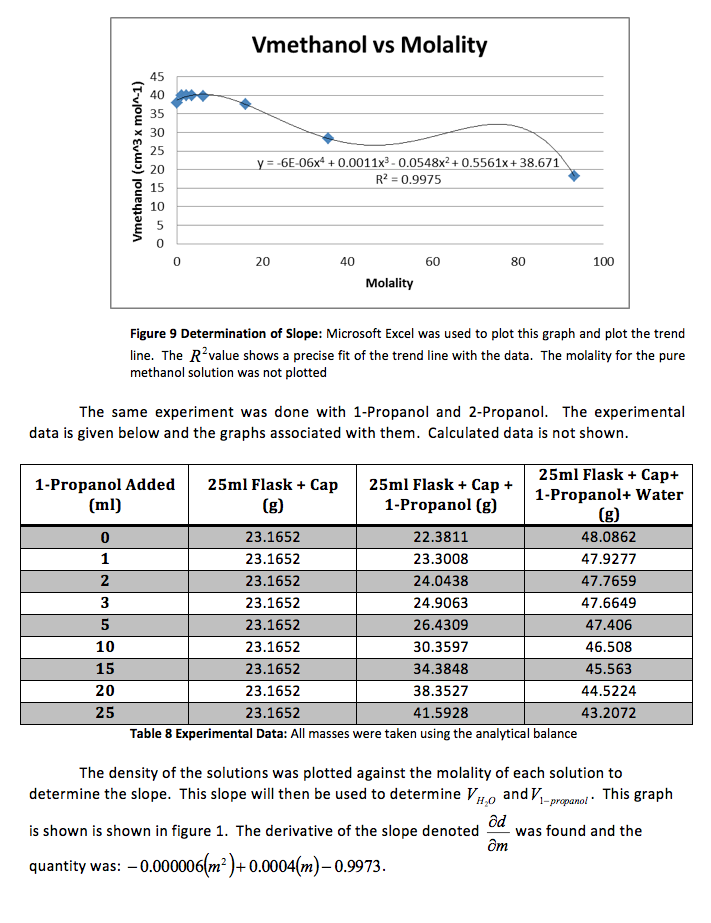
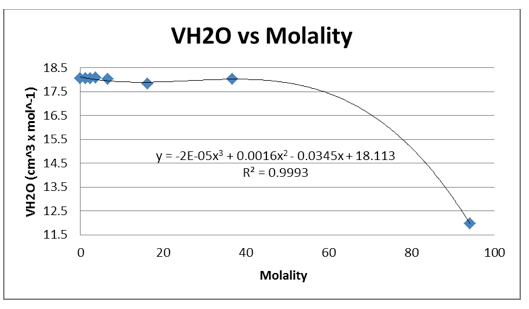
We were again instructed to plot the partial molar volumes against the molality of each solution.
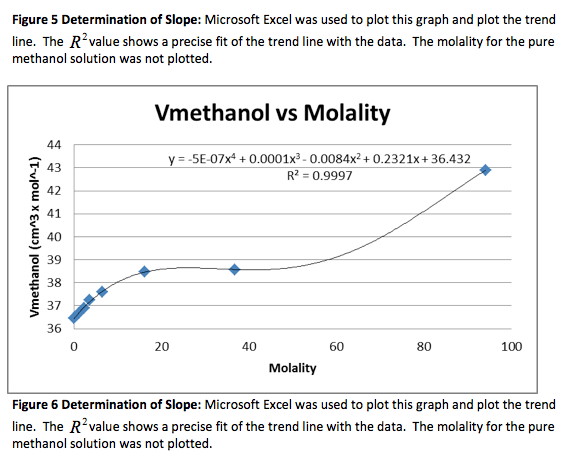
We were given the experimental data from the other groups. We analyzed the other methanol data and found that both groups had very similar outcomes. Below is the experimental data from one of the groups and the graphs. The calculated data is not included.