Spectroscopic Analysis of Chlorophyll
The absorption spectras of the five different solutions all differ in max wavelengths and ranges of wavelengths. The blue food coloring had one peak with a max absorption of .1201 at 630.7nm. The 1:1 mix of blue and yellow food coloring had two peaks with a max absorption of .1911 at 421.1nm. The yellow food coloring has one peak with a max absorbance of .3734 at 422.9nm.
| Type of Solution | Color of Solution | lmax values |
| Blue Food Coloring | Blue | 630.7 nm |
| Yellow Food Coloring | Yellow | 422.9 nm |
| Mixture of Yellow and Blue Food Dye | Light Green | 421.1 nm |
| Chlorophyll a Standard | Light Green | 447.0 nm |
| Spinach Leaf Extract | Light Green | 445.4 nm |
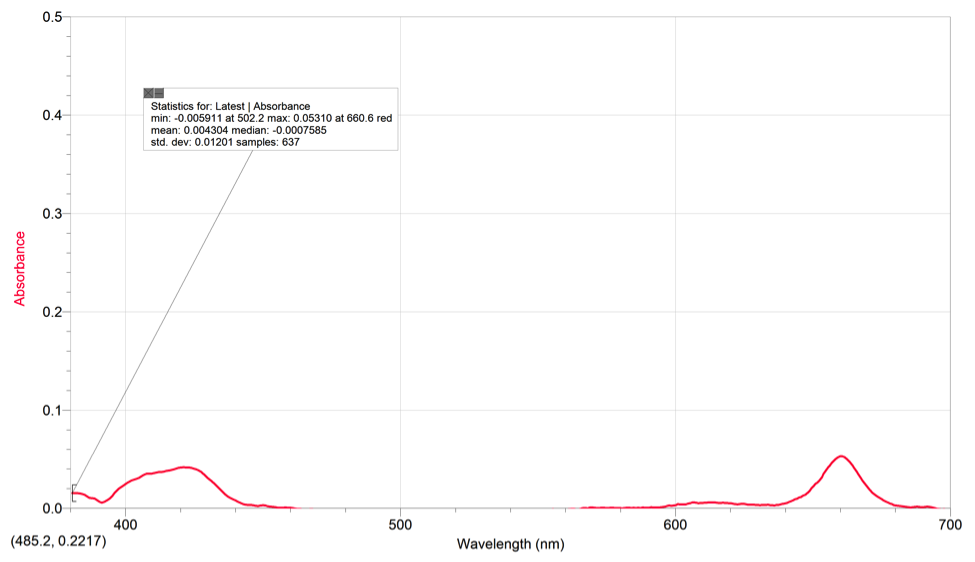
Chlorophyll A also had two peaks with a max absorbance of .05310 at 660.6 (red).
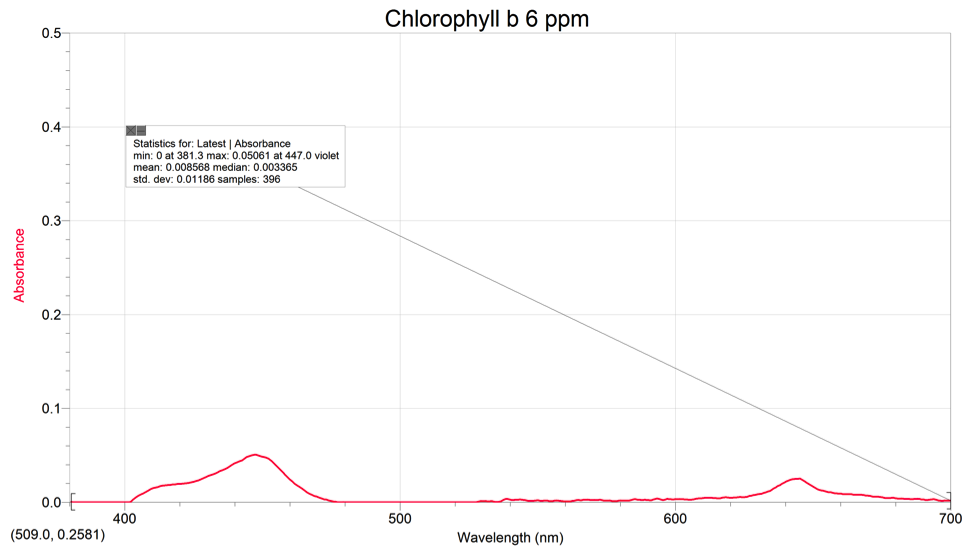
Chlorophyll B had 2 peaks with a max absorbance of .05061 at 447.0nm (violet).
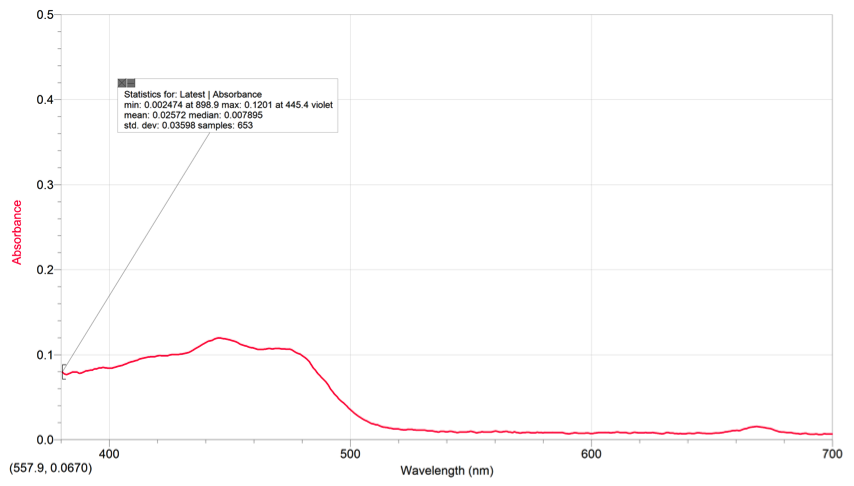
The spinach extract had a max absorbance of .05310 at 445.4nm and 1 peak. 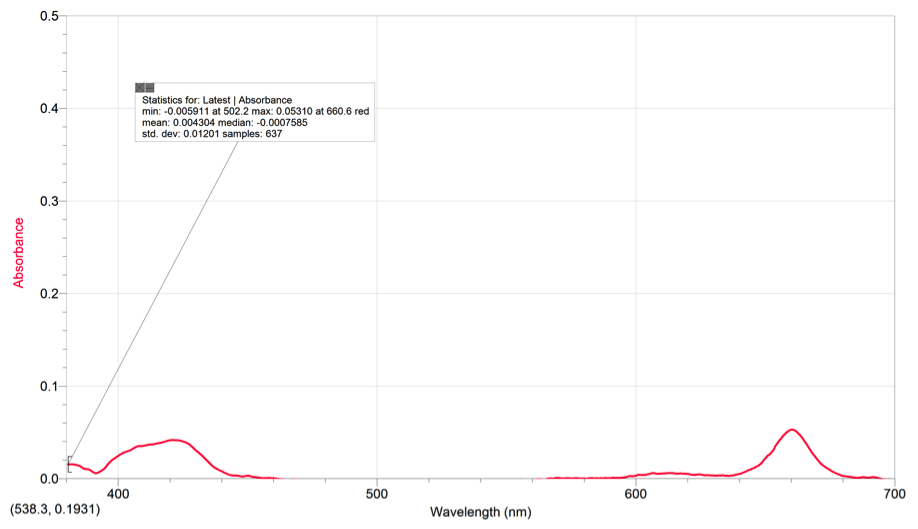
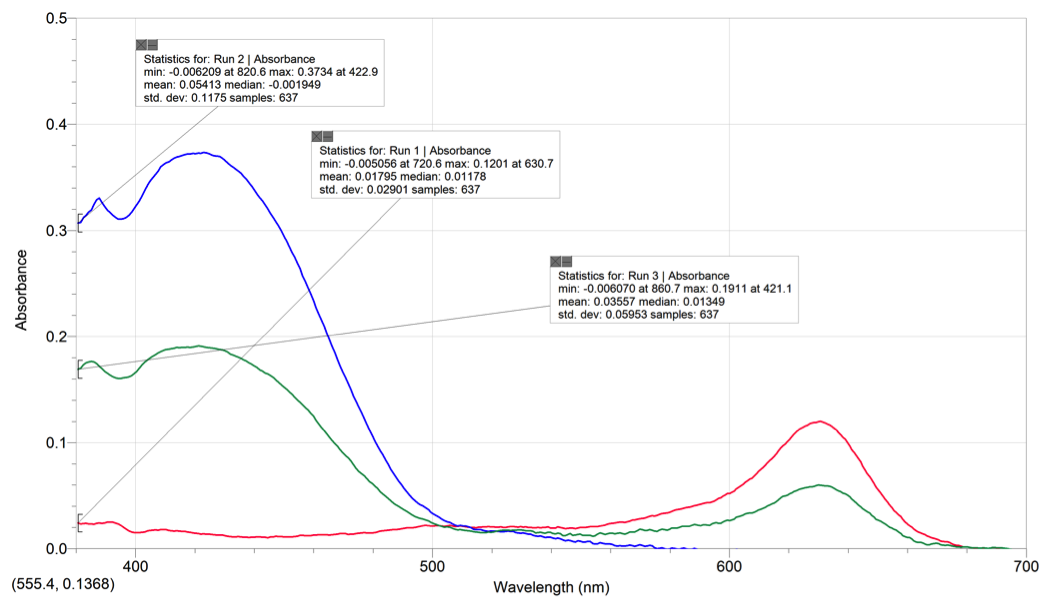
When the compound’s spectrum has more than one maximum wavelength, it indicates that the compound is able to absorb light at multiple wavelengths (colors). In the graph with the food coloring spectras, the 1:1 mix had a peak in the blue and yellow wavelength ranges of the spectra and a drop in the green part. The solution absorbs the light at those wavelengths but not at the wavelength range of green. The green is thus reflected off the solution and the solution will change into a green color. This is also seen in the spectras of spinach, chlorophyll a, and chlorophyll b, which are all colored green.
If we were given the spectras without any titles or information, we could match the solution’s identity by looking at the number or peaks and the wavelength range of each colored solution. By looking at the number of peaks on the graph and the ranges of where the peaks are, we can identify which solution it is. For example, for the 1:1mix solution, if there are two peaks, one at the wavelength range for blue and the other at the wavelength range for yellow, we will know that the solution definitely cannot be of blue or yellow color since the graph tells us that those lights are absorbed and will not be reflected. The graph also shows no peak at the wavelength range for green and will thus allow us to identify the green 1:1 mix. The way to distinguish Chlorophyll A & B is to look at the end peaks. Chlorophyll A has a higher end peak than Chlorophyll B. As for the blue food coloring, we can identify it by looking at the graph where there the graph is flat at the wavelength range of blue light (400~500nm). Similarly, yellow food coloring’s graph would have a flat surface at the wavelength range of yellow (500~600nm). We look for the maximum wavelength of each unknown solution and compare them to the color wheel to find the absorbance color. Then we match it to its complementary color and that determines the solution’s color. Solvent matters because it has small effects on the HOMO and LUMO gap affecting the color absorbed.
Solvent also matters because it is used as a blank for the measured solutions. If we do not use the correct solvent for each solution, the spectras would be inaccurate. The spectrometer is calibrated with the correct blank (solvent) in order to exclude the unnecessary spectra of the solvent to have a clearer spectra of the analyte we are observing.
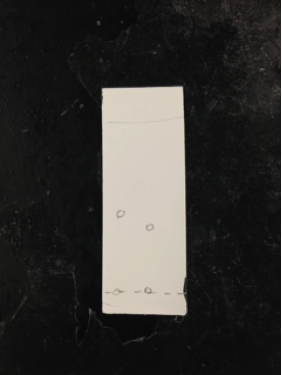
Compounds spotted on the TLC plate are separated by polarity. The closer the spots are to the solvent front, the more nonpolar the spots are in comparison to the spots that are closer to the line of origin. The four spots on our plate of different colors represent the different compounds. The silica powder allows the nonpolar compounds to have more mobility while the polar compounds have more limited mobility. Spots from least polar to most polar are: carotene, phenophytin, chlorophyll, & xanthophyll. The colors observed under uv light are light orange, yellow, yellow-green, and light yellow. The most polar compound out of the four is xanthophyll because it H-bonds with two hydroxyl groups. Next in highest polarity is Chlorophyll because of its Mg ion which gives more electronegativity. Phenophytin has bonds between nitrogen and hydrogen and carotene contains all hydrocarbons, meaning it is nonpolar. Referenced used was a website about spinach lab extraction (Scribd).
 Using our chlorophyll a & b spectras and the color of pigments from the TLC, we can see that the area where the pigments are absorbing on the spinach extract’s spectrum is around the range of 400-500nm (violet-blue). The pigments also absorb some light on the 680-690 range (yellow/red). These spectrums all contain peaks within the 400-500nm range and the 600-700nm range. The peaks on the spectra represent the place where the pigments are absorbing light and what kind of light on the visible light spectrum. On the TLC plate, xanthophyll and phenophytin both have a yellow color, meaning that they absorb a violet color on the spectrum.
The excitation wavelength we used was 405nm. We did not use 500nm because the Chlorophyll stock solution’s spectra had negative values at the 500nm range. Thus, we used the 405nm excitation wavelength because the spectra had positive values in that range and our TA told us to use 405nm.
Finding the molar absorptivity using Beer’s Law
= 0.0067 mol chlorophyll A
((10^6 g hexane)/ (0.65480 g/ml))/(1000)= 1527L
Molarity = = 4.4×10⁻⁶ M
Week 1 Molar Absorptivity of Chlorophyll:
1. Wavelength at max absorbance .0420 of chlorophyll a: 421.1 nm violet
2. Wavelength at max absorbance .0531 of chlorophyll a: 660.6 nm red
Beer’s Law = A= (ε)(c)(l)
(0.0420)=( ε)(4.4×10^-6 M)(1.20cm) (0.0531)=( ε)(4.4×10^-6M)(1.20cm)
ε =7.95×10^3 M^-1cm^-1 ε =1.01×10^4 M^-1cm^-1
Concentration of chlorophyll a in diluted spinach extract solution:
1. Wavelength at max absorbance .1201 of chlorophyll a: 445.4 nm violet
2. Wavelength at max absorbance .0160 of chlorophyll a: 668.9 nm red
For 445.4nm:
0.1201= (7.95×10^3 M^-1cm^-1)(c)(1.20cm)
c= 1.26×10^-5 M Chlorophyll A
For 660.6nm:
0.0160= (1.01×10^-4 M^-1cm^-1)(c)(1.20cm)
c= 1.32×10^-6 M Chlorophyll A
= 11.3 mg/L = 11.3 ppm
= 1.18 mg/L = 1.18 ppm
Concentration of chlorophyll a in undiluted spinach extract solution
(M1)(V1)=(M2)(V2)
(1.26×10^-5)(1.2ml)=(M2)(2ml) (1.32×10^-6)(1.2ml)=(M2)(2ml)
M2=7.56×10^-6M M2=7.92×10^-7M
= 6.75 mg/L = 6.75 ppm
= 0.708 mg/L = 0.708 ppm
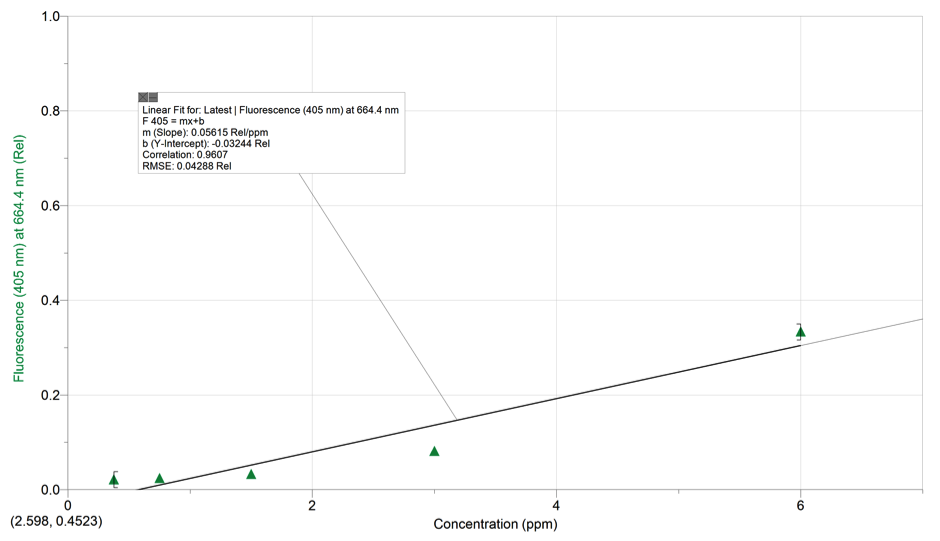 Beer’s Law Equation : y= .05615x-0.03244
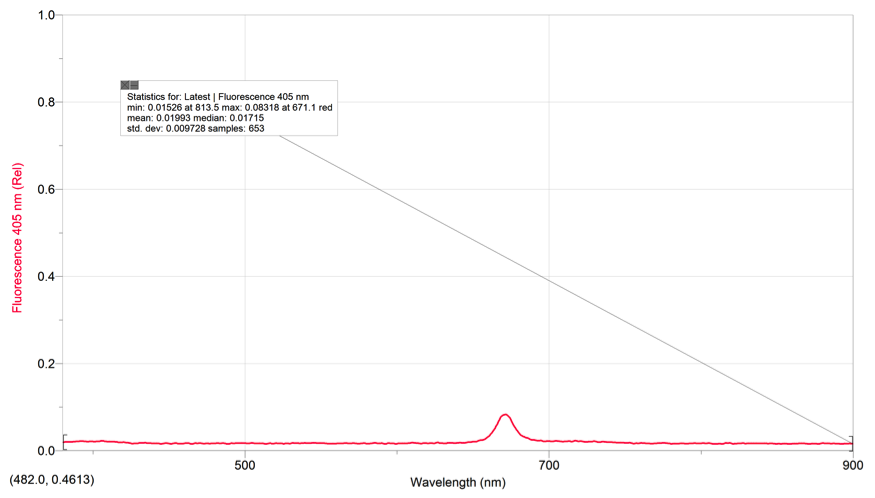
F Value for Fluorescence spectrum of the diluted spinach extract solution: 0.08318
F=Kc
K= slope= .05615 (Rel/ppm)
F= .08318
(.08318)=(.05615 Red/ppm)(c)
c= 1.48ppm
Chlorophyll in Undiluted Spinach Extract Solution
F=Kc
K=slope=.05615 (Rel/ppm)
F= .333
(0.333)=(.05615 Rel/ppm) (c)
c= 5.93ppm
The concentration from #5 might be different from #6 because when we measure for absorbance, multiple wavelengths are taken into account. However, when measuring fluorescence, the concentration is measure at one wavelength and thus there is less variation.
