A Spectroscopic View of Drug and Protein Binding
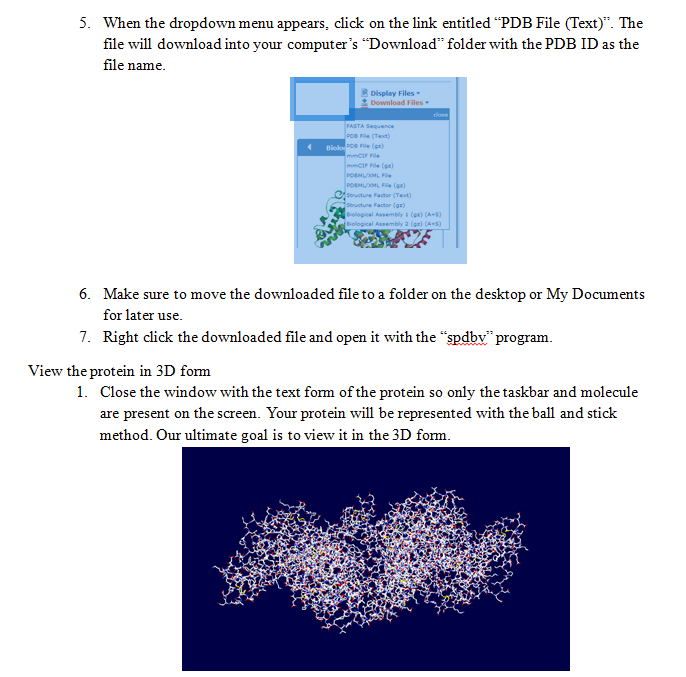
Laboratory Manual
Objectives. After completing this laboratory module, you should be able to:
- Understand, broadly, what occurs when drugs bind to blood serum proteins.
- Demonstrate proper use of the commercial UV/Vis spectrometer.
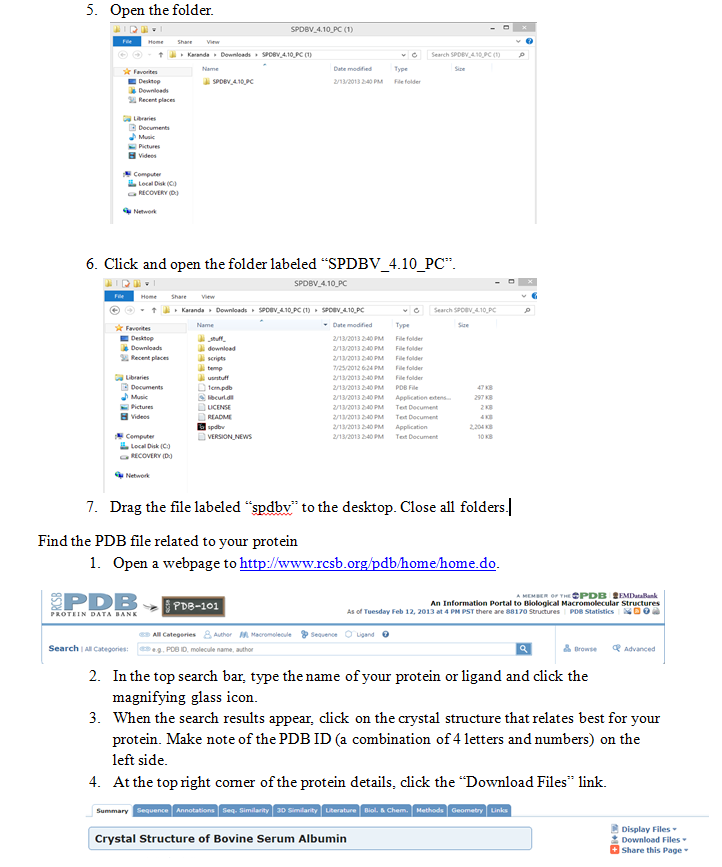
- Describe what happens to drug binding when concentration is varied.
- Use basic programming to upload and view a three dimensional protein structure.
Introduction
The most abundant amino acids in HSA are alanine (Ala), lysine (Lys), leucine (Leu), and glutamic acid (Glu).1,2 The abundance of the amino acids is relatively the same as that of BSA. Therefore, we can expect the binding behavior to be relatively the same with both serums. This protein in particular is found in human blood and has a high binding affinity to various drugs.
In this lab, binding of a few types of drug will be investigated with respect to BSA. One of these drugs, caffeine, is classified as methylxanthine. Methylated xanthine derivatives act as mild stimulants upon ingestion, and at high enough concentrations in the bloodstream can increase the risk of cerebrovascular accidents and myocardial infarctions by increasing platelet aggregation and decreasing endothelial function.
With the development of highly concentrated caffeinated beverages such as Red Bull and 5-Hour energy, concerns about these potential negative health risks has increased. Before the commercial production of highly concentrated energy drinks and supplements, overdose due to caffeine consumption was physically not feasible based on the sheer volume of liquid needed to be ingested to achieve a dangerous amount of caffeine. In 2011, a 28-year old man was taken to an emergency room after he experienced tonic-clonic seizures due to consuming 6 cans of Redbull together with coffee in a period of 4 hours.3 Since then, 13 deaths have been attributed to the consumption of highly caffeinated energy drinks, often in tandem with alcohol.4 A total of 52% of energy drink emergency room visits are for people between the ages of 18 and 25.
The Food and Drug administration currently does not require energy drinks to list warnings of excessive caffeine consumption or limit the amount of caffeine they contain. However, in as early as 2009, reports were published calling for warnings on these types of energy drinks (such as in Drugs and Alcohol Dependence) related to their potential health risks.
Materials
- Bovine Serum Albumin (BSA)
- Caffeine
- Monobasic sodium phosphate (NaH2PO4)
- Dibasic sodium phosphate (Na2HPO4)
- Nanopure water
- Alanine (Ala)
- Lysine (Lys)
- Glutamic acid (Glu)
- Leucine (Leu)
- Cary UV/Vis spectrometer
- Quartz cuvettes
- Associated glassware
- Swiss PDB viewer
Procedure
Sample Preparations
The following solutions need to be made. Calculations for reagents should be made prior to coming to lab.
- 1L of a phosphate buffer at pH 7.3
- 3X10⁻⁶M caffeine solution prepared in phosphate buffer
- 3X10⁻⁶M BSA solution prepared in phosphate buffer
- 3X10⁻⁶M solutions of the following amino acids prepared in phosphate buffer: Ala, Leu, Lys, and Glu.
UV/Vis Spectroscopy
When using the UV/Vis, remember to run in double beam mode with phosphate buffer as your reference. Analyze the following:
- Caffeine solution
- BSA solution
- Equal parts of Caffeine and BSA
- Equal parts of Caffeine and Leu
- Equal parts of Caffeine and Glu
- Equal parts of Caffeine and Ala
- Equal parts of Caffeine and Lys
Remember to save data as a CSV file for viewing in Excel.
Use the Swiss PDB Viewer to Look at BSA
Download PDB viewer
- Go to http://spdbv.vital-it.ch/disclaim.html.
- Click on the “I agree statement” at the bottom off the screen.
- Click on the program download based on your operating system. The user guide for the program is also located on this screen.
- Extract the files downloaded from the website. Save to desktop.
 2. Click on the “Display” tab in the taskbar. Click on “Render in Solid 3D”.
3. Click on the “Wind” tab in the taskbar. Click on “Control Panel”. A panel should appear on the right side of the screen with a list of the protein sequences for the molecule.
4. Click and drag on the first column (show) of “v”s to make them disappear. Repeat with the second column (side). Your screen should show no molecule at this point.
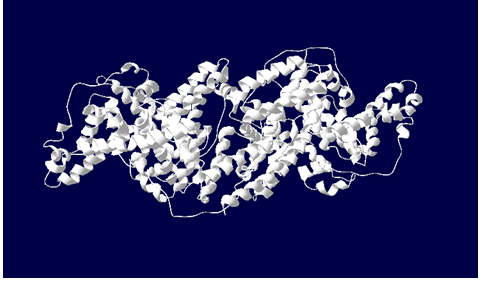
5. Click and drag the entire fourth (::v) and fifth (ribn) columns to make the “v”s appear. A 3D, solid colored molecule should now appear in your screen.
Lab Write Up
In your lab report, you should include the following in your detailed discussion:
- Calculations for all made solutions
- Data obtained from the UV/Vis spectrometer along with analysis
- λmax values for caffeine, BSA, and each of the bound mixtures
- The PDB ID number for bovine serum albumin
- Screen shots of both the ball and stick and 3D BSA models obtained from the Swiss PDB viewer (with time stamps)
References
1 Friedli, G. L. Interaction of Deamidated Soluble Wheat Protein (SWP) with Other Food Proteins and Metals. Ph.D. Dissertation [Online], The University of Surrey, Guildford, Surrey, UK, 1996. http://www.friedli.com/research/PhD/chapter5a.html#struc (accessed Feb 1, 2013).
2 Sigma-Aldrich. Enzyme Reagents. http://www.sigmaaldrich.com/life-science/metabolomics/enzyme-explorer/enzyme-reagents/human-albumin.html#AAC (accessed Feb 1, 2013).
3 Emerg. Med. J. 2011; 28: 712-714
4 Chem. Eng. News. 2013; 91: 9-12
