State Efficient and Clean Energy Incentives: Effect on Natural Gas Consumption
Over the past several years, U.S. governing bodies from the federal to the municipal level have imposed various financial incentives to promote the use of efficient and clean energy sources. These incentives range from tax breaks, special financing, and rebates to make these products the first option for consumers rather than a pricey alternative. Alternative energy sources and efficient equipment aren’t cheap and maintaining these programs isn’t either. Between 2005 and 2008, the state of California spent over 2 billion dollars in research to decide just how much money to spend on such programs (CA Budget 2006, pp. 4). It is therefore pertinent to examine the effectiveness of these programs.
As of 2013, every state in the union has some kind of incentive program for efficient and clean energy (DSIRE Database). Most states have several incentive programs; some states have upward of 100 (DSIRE). The question this paper seeks to answer is, how have these programs affected, if at all, natural gas consumption in their respective localities? To answer this question, it must first be known what exogenous variables contribute to energy demand to establish a baseline of how consumption changes naturally. When examining natural gas consumption it is necessary to look at how the local climate influences demand, for as far back as the U.S. Energy Information Administration (EIA) has kept records. This paper will narrow its sample to ten states, which will be separated into two categories, the first half being states with the greatest amount of financial incentives, the experimental group, and the second half, the control group, with the least amount of financial incentives.
States to be Considered and Policy Distribution
There are ten states that this paper examines, which have been separated into 2 groups. The first group, the experimental group, examines those states that have enacted the most incentive programs to promote clean and efficient energy. This group consists of Minnesota, California, Oregon, Florida, and Indiana. The second group, which was used as the control group, contains the states of West Virginia, Kansas, Maine, Arkansas, and Alaska.
The Experimental Group
Minnesota was the first state to be considered. They have enacted over 108 energy efficiency incentive programs (DSIRE), making it the state with the most such programs in the union. The governments of Minnesota have enacted 93 tax rebate programs, 4 grant programs, and 11 different lower interest loan opportunities (DSIRE). These programs are directed for both industrial sectors and residential.
It was not at all surprising that the most populous state should also be considered. California has 105 programs incentive programs in place (DSIRE). Of these, 78 programs are tax rebates, 4 in the form of grants, 18 are loans, and 5 green building incentives (DSIRE). Green building incentives usually consist of waiving the fee for a building permit in an attempt to mitigate the cost of construction (DSIRE).
Oregon has 67 such incentives policies in place (DSIRE). Person tax reductions account for 3, 2 are corporate tax write-offs, 48 tax rebates, 1 utility grant, 3 state loan programs, 9 utility loans, and 1 local green building incentive (DSIRE). Out of all the states considered, Oregon has the most diversified range of policy incentives at its disposal.
Florida is perhaps the most interesting subject involved in this paper. It has the most consistently warm climate of all the states considered and does not require as much energy devoted to heating as the other states. This may perhaps lead to incentives having greater influence over consumption than any of the other states. In total, Florida has 47 active programs; 1 corporate tax write-off, 35 tax rebates, 2 grants, 1 state loan, 3 local loans, 3 utility loans, and one green building incentive (DSIRE). Like Oregon, Florida is also pretty diverse in their policy mechanisms.
The last state in the experimental group is Indiana, which also has 47 ongoing policy incentives. 42 of these are tax rebates, 1 state grant program, 2 loans, and 2 different green building incentives (DSIRE).
The Control Group
Of all the states identified for the control group, Kansas ranked dead last in incentives offered for green and efficient energy. The governments of Kansas have only enacted 2 policy mechanisms to promote this behavior (DSIRE). There is only 1 tax rebate, and just 1 loan program that has been established. The fact that there are so few incentives in place make it almost entirely impossible for these programs to have any impact on the consumption of natural gas, making Kansas the perfect control specimen for this study.
Second to last in the United States comes West Virginia, which only has one more program than Kansas (DSIRE). All 3 of West Virginia’s program incentives are in the form of tax rebate. Only one of these rebates covers residential use. A utility rebate has been established which covers maintenance such as air duct cleaning, heat pump upgrades, and insulation improvements.
Alaska ranks third to last with just 8 incentive programs (DSIRE). Alaska currently offers 1 state tax rebate, 2 utility tax rebates, and 5 state loan programs (DSIRE). The loan program offers minimal support, with just a maximum interest rate reduction of a consumer’s loan of .5%. The rebates offered to consumers are also minimal, covering small costs between $20-$40 of energy efficient home upgrades (DSIRE).
Maine only has 11 programs that it offers to residents and businesses. Their energy efficiency incentives program contains 5 state tax rebates, 3 utility rebates, and 3 loan programs (DSIRE). Maine also is the 2nd smallest consumer of natural gas is the United States, so programs with potential to reduce consumption may have very limited effects.
The last state to be considered in the control group is Arkansas. Arkansas only has 16 programs in place, but that total is more than Alaska, West Virginia, and Kansa combined (DSIRE). The programs aren’t very diversified; however, 11 programs are utility tax rebates and 6 are in the form of loans, half state and half utility (DSIRE).
Weather Compared to Residential Consumption
In analyzing the consumption of natural gas in these ten states, it is necessary to understand what else other than policy mechanisms might influence consumer behavior. The most obvious factor to consider in the case is the role the climate plays in effecting demand. Eight of the ten states were used in this comparison. California was ignored due to the geography of the region; heating degree data could only be found on a city-by-city basis, and the climate of California can vary dramatically from city to city, therefore, an accurate comparison may not have been made. Kansas was left out of the comparison because of lack of good data.
Analyzing the Trend
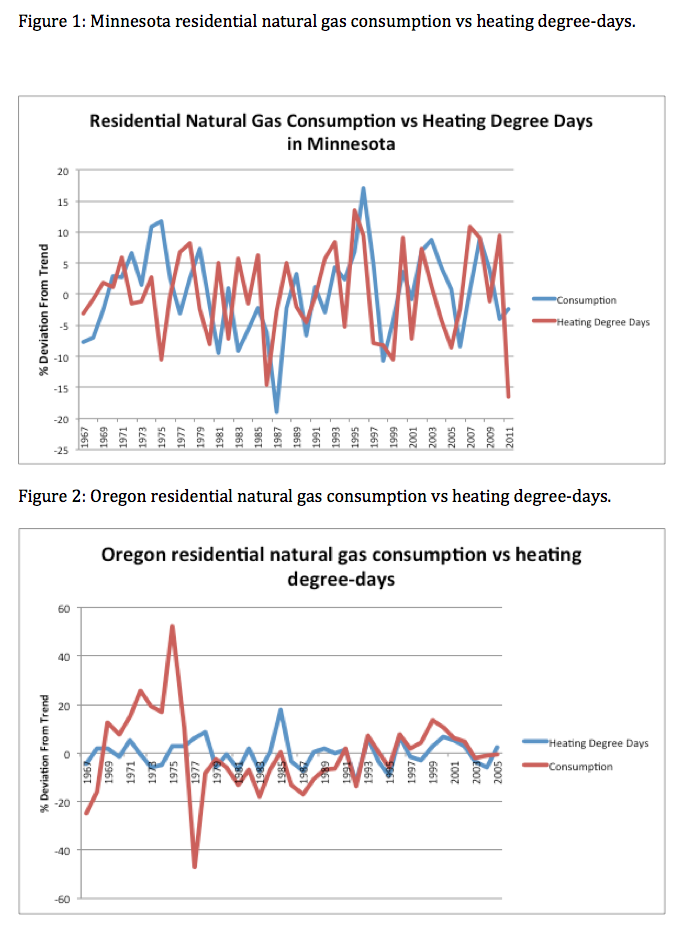
Comparing the states natural gas consumption to heating degree-day indexes, days that the temperature fell below 60 degrees Fahrenheit (WRCC), requires a time scale evaluation of the trend of both variables. Data could be found for both as far back as 1967 in all cases; however, some states didn’t have indexes after 1990. By comparing the percent deviation from the trend in heating degree-days to the percent deviation from the trend in residential consumption, the two variables can be easily compared.
The comparison of Minnesota heating degree-days to residential consumption painted the best picture of the relationship between the two. As seen in figure 1, it is crystal clear that two variables move in a procyclical manner. The graphs don’t form a perfectly symmetrical pattern; however, the majority of measurements tend to move together throughout time. Whenever the amount of heating degree-days in a year tends to be above trend, the amount of natural gas consumed in that year also seems to be above trend. The same is true vise versa and when one falls below trend.
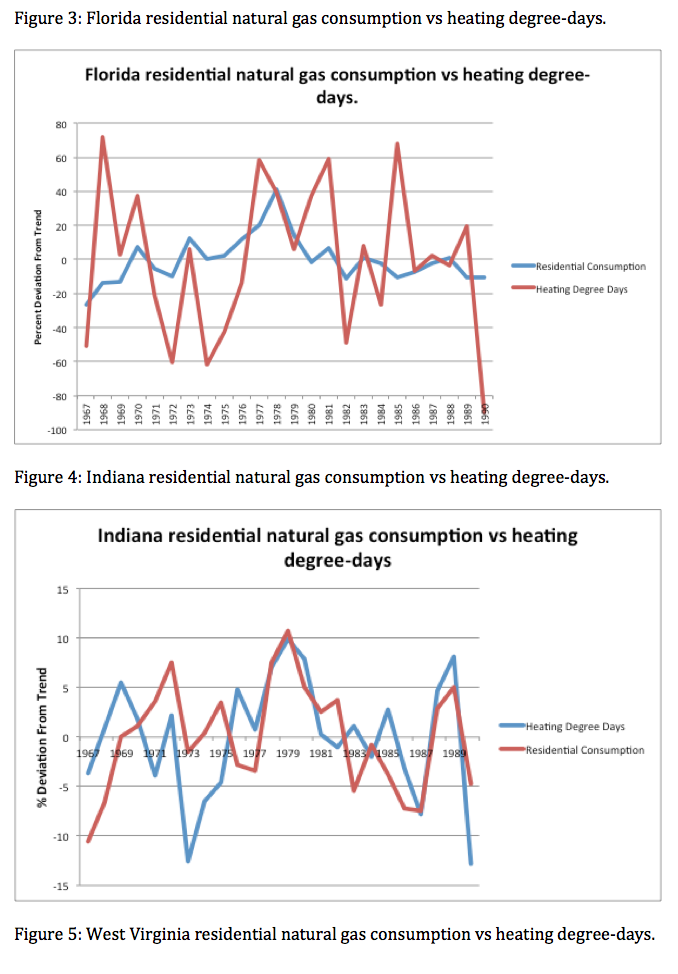
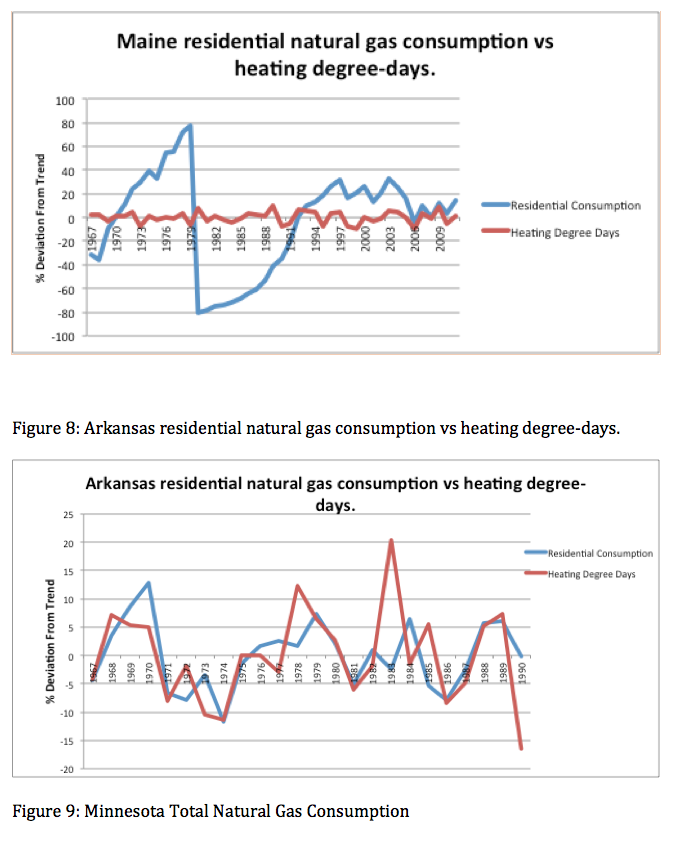
The pattern that is exhibited in Minnesota seems to take place in the states considered except for two, Florida and Maine. As evident in figure 3, in over 40 years of recorded data, no relationship seems to exist between natural gas consumption and heating degree-days. This doesn’t necessarily mean that there is no relationship, but on the aggregate level no real pattern has emerged. Florida tends to have one of the warmest climates in the U.S.; therefore, natural gas may not be used primarily for heating in households.
Maine is a very interesting case as well. It happens to be the northern most state on the eastern seaboard and has one of the colder climates in the United States. Maine, however, uses mostly oil as a household-heating source. It is the 2nd lowest consumer of natural gas in the United States.
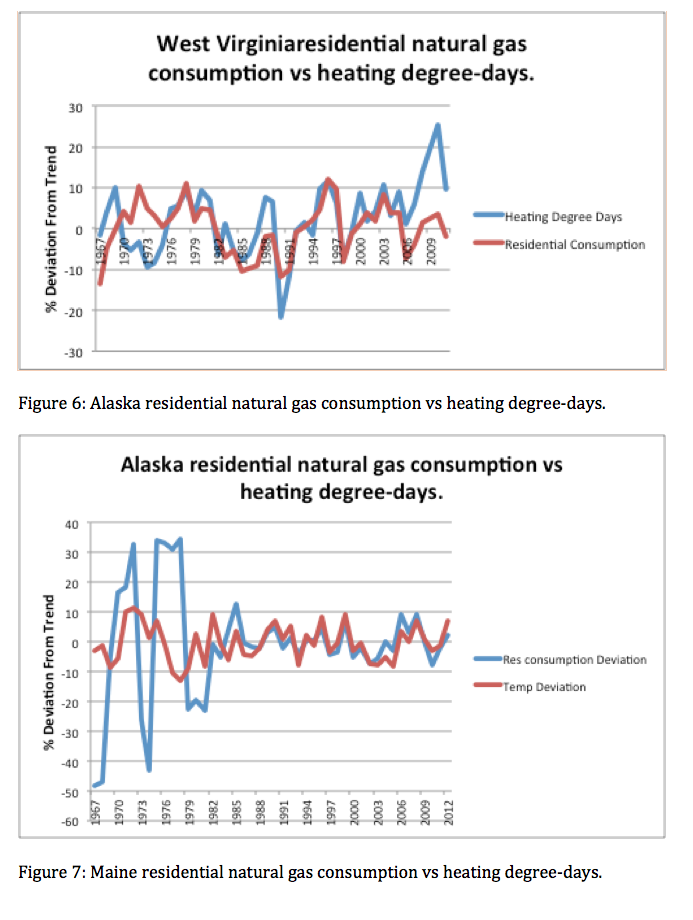
It is important to note the graph of West Virginia as well. The records indicate that 2009 was the warmest year on record in the state. The amount that the heating degree-days for that year deviated from the trend was 80%, which was nearly 4 times as much as any other year. For that reason the year 2009 was not considered in the analysis. The discrepancy was inhibiting the accuracy of the regression.
Policy Effect on Consumption
Now that the patterns between consumption and climate demands have been established, there is now a foundation to examine the effects of policy mechanisms. Energy efficiency incentives are a relatively new mechanism, having mostly been established during the recession of 2008-2009. The effect of such mechanism should show up in short term data, since installing a more efficient furnace or water heater will have an immediate impact on a consumer’s consumption. Within the 3-4 years for which these mechanisms have been in place, any impact on consumption should show up in the analysis.
Experimental Group
Minnesota has the greatest number of the mechanisms that this paper intends to look at. The majority of these incentives are in the form of tax rebates for equipment purchases. The intent is to make high efficient furnaces, air conditioners, water heaters, and other equipment more affordable to consumers. Consumers are also offered low interest loans for purchasing equipment and making house improvements of up to $5,000 (DSIRE). Better insulated houses and more efficient equipment would mean that natural gas consumption required to heat homes would be less than what it takes to heat a home without such improvements; therefor, if these incentives were taken advantage of to their full extend, it should be expected that consumption should either decrease, not increase, or increase at a slower rate than what it had been.
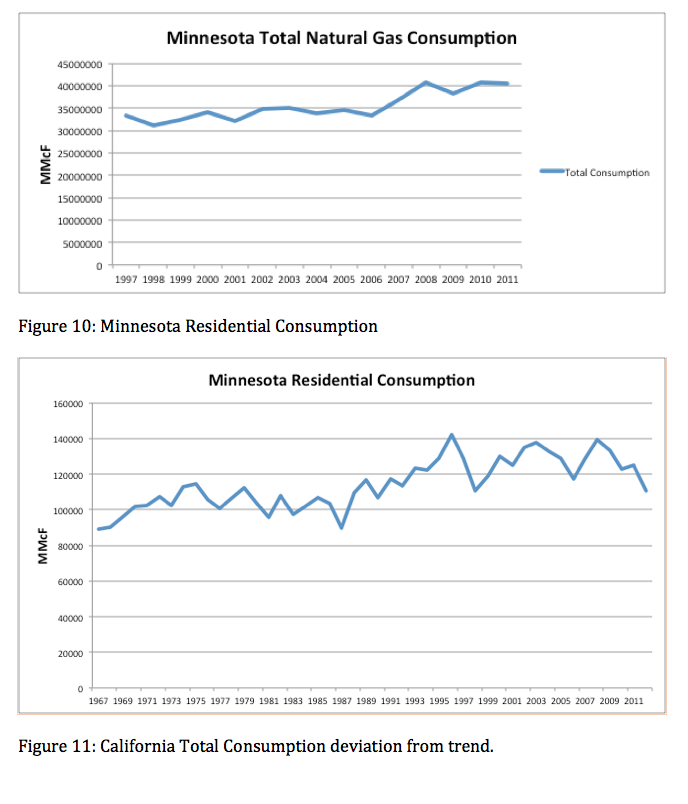
Minnesota’s consumption of natural gas for residential use has closely followed the same trend as climate demand for heating since 1967, as far back as data has been kept by the EIA. In 2010 the amount of heating degree-days was 10% higher than the trend for the past 40 years. In that year residential consumption was 5% below trend. While it can’t be said that consumption fell because of Minnesota’s incentives, it also can’t be said that these programs did not work. After all, it is easier to prove something to not be working than it is to prove that it works.
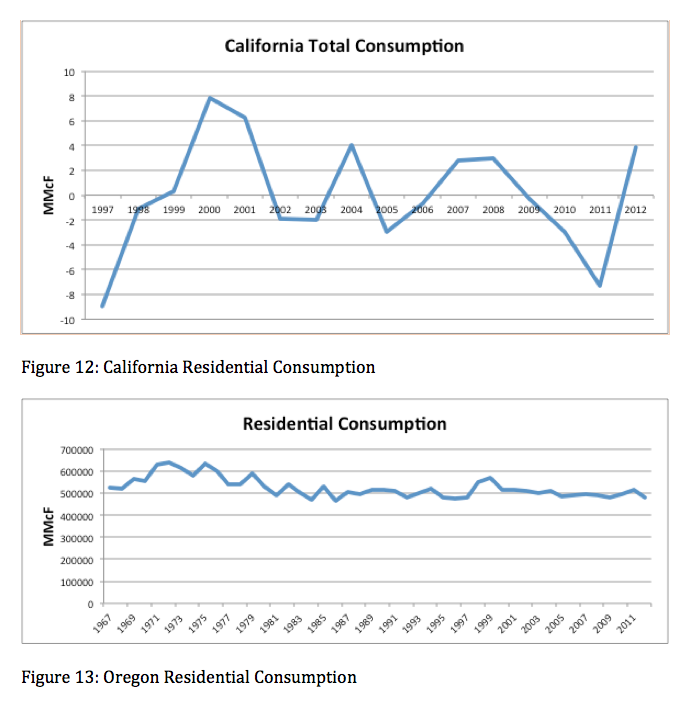
California, which was not compared to weather statistics, experienced a similar pattern for the year of 2009. California’s incentive portfolio contains the second most incentives in the United States at 105. From 2009 to 2011, the natural gas consumption fell almost linearly to 8% below the 40-year trend (Figure 11). Figure 12 shows that California experienced no growth in the amount of residential natural gas consumption from 2009 to 2012.
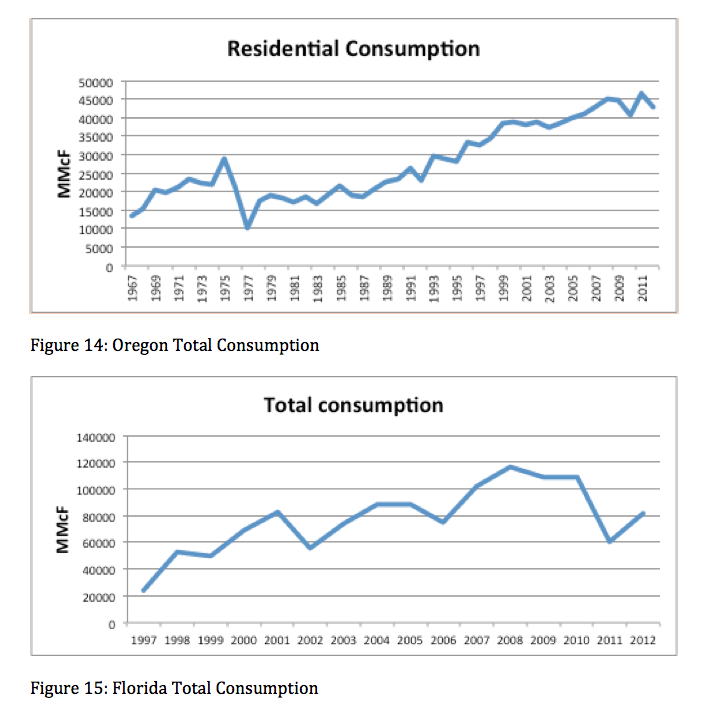
Oregon, which didn’t have heating degree-day data for their program years, experienced sharp decrease in both residential and total natural gas consumption in 2009 (Figure 13,14) followed by a sharp increase in consumption. The decrease could perhaps be due to the recession that took place during those years; however, consumption has not returned to the levels they were prior to the recession. This may or may not be due to the policies Oregon put in place during those years.
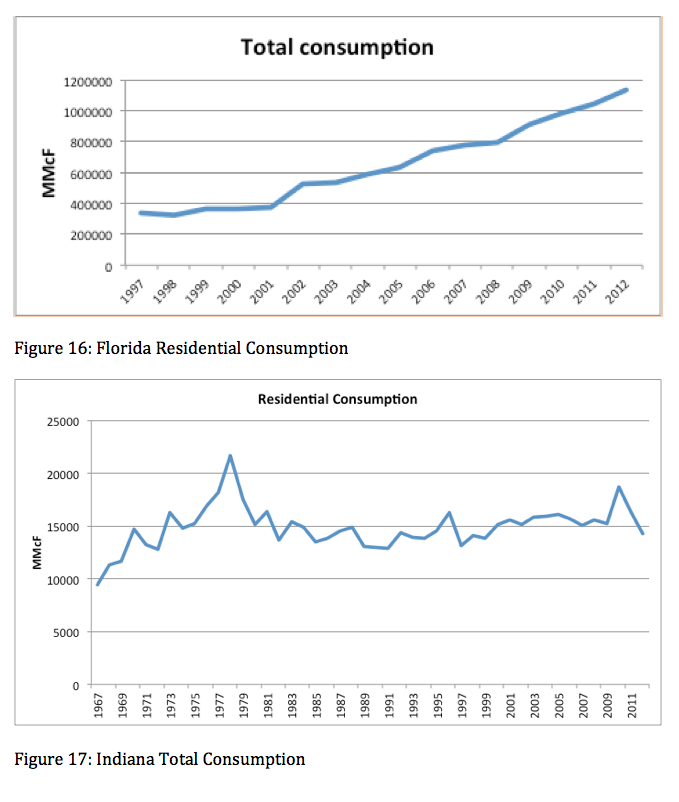
Florida exhibits the most intriguing consumption characteristics of any state. Their consumption of natural gas doesn’t seem to depend on climate factors. During the recession year’s consumption increased in Florida, and was above trend until 2011 (Figures 15,16). Residential consumption, however, did decrease during those years and has yet to make any kind of recovery. There is no evidence tat residential incentives didn’t work in Florida, but it does seem that corporate and other incentives may have failed in lowering consumption.
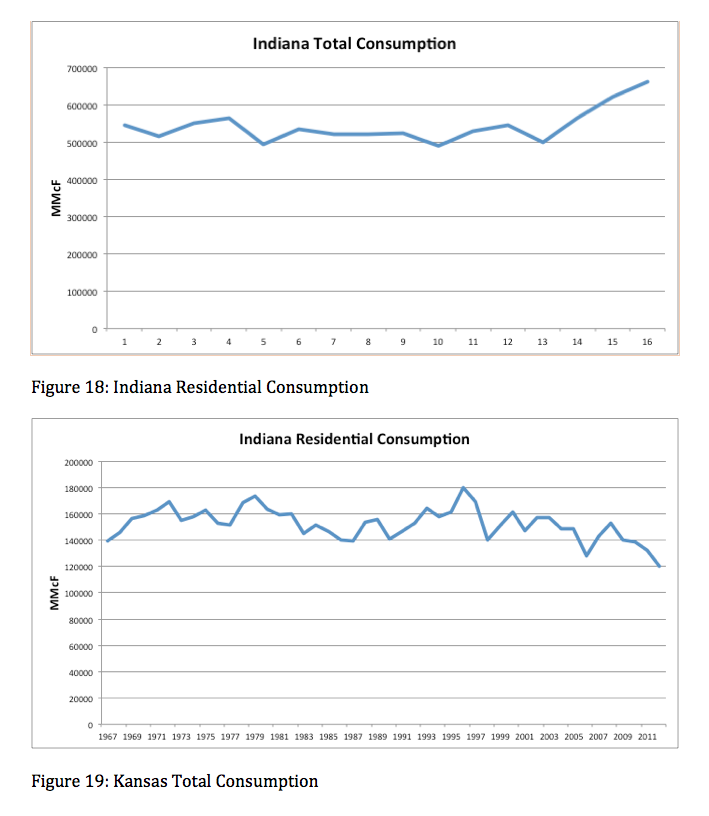
Indiana was the last state to be considered in the experimental group of states. There was no weather data available for the program years examined. For the years of 2009-2011 residential consumption did drop off; however, total consumption increased (Figures 17,18) during a recession. Though not definitive, this is strong evidence to suggest that policy mechanisms failed to make any difference in consumption behavior.
Control Group
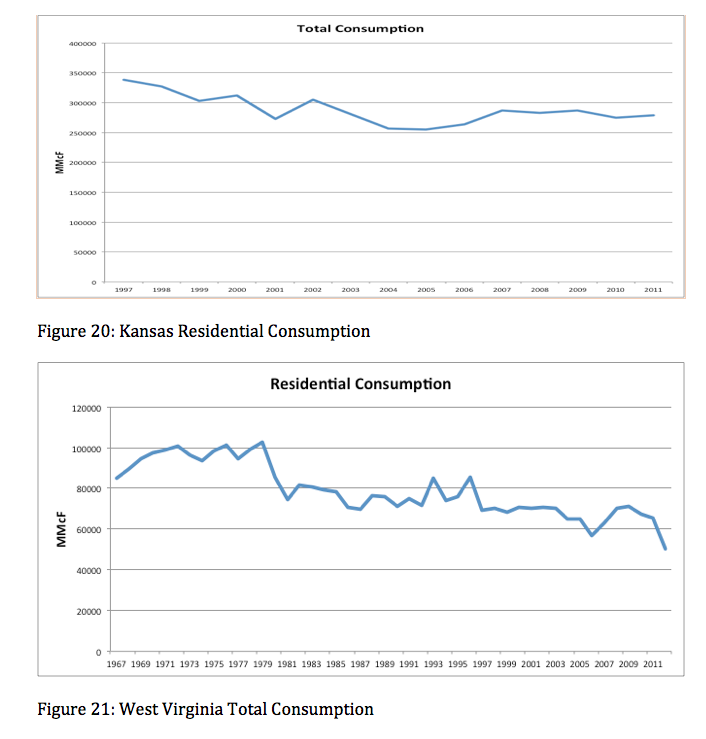
Kansas had the least amount of incentives offered out of any state in the union. There was no data available on yearly heating degree-days, so nothing can be said about how climate demands influence consumption. During the years of energy efficiency programs, consumption of residential natural gas decreased and total consumption remained stagnant (figures 19, 20). Even though natural gas consumption decreased during this time scale, consumption still kept above trend, by as much as 10%, during the heart of the recession. This may be good news compared to the states with more policies in place, whose consumption decreased during this time.
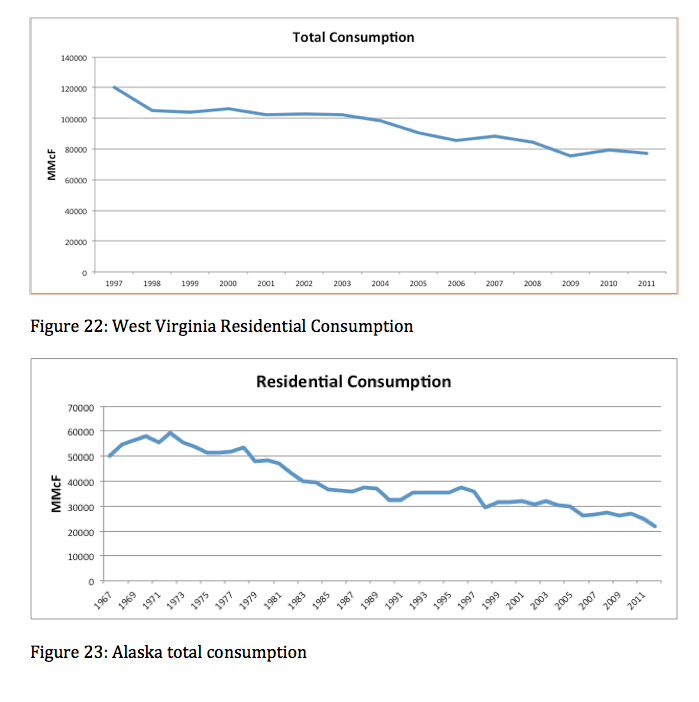
West Virginia, which has the second lowest amount of incentives in place, exhibited much the same characteristics as Kansas; however, heating degree data was available (Figure 5) and while consumption was above trend during the policy years, so to was the amount of heating degree-days. Residential consumption and total consumption decreased slightly during these years as well. Like West Virginia, Minnesota also had above trend heating degree-days, although their consumption was below trend for those years; another positive sign that these policies may have had an impact on consumption.
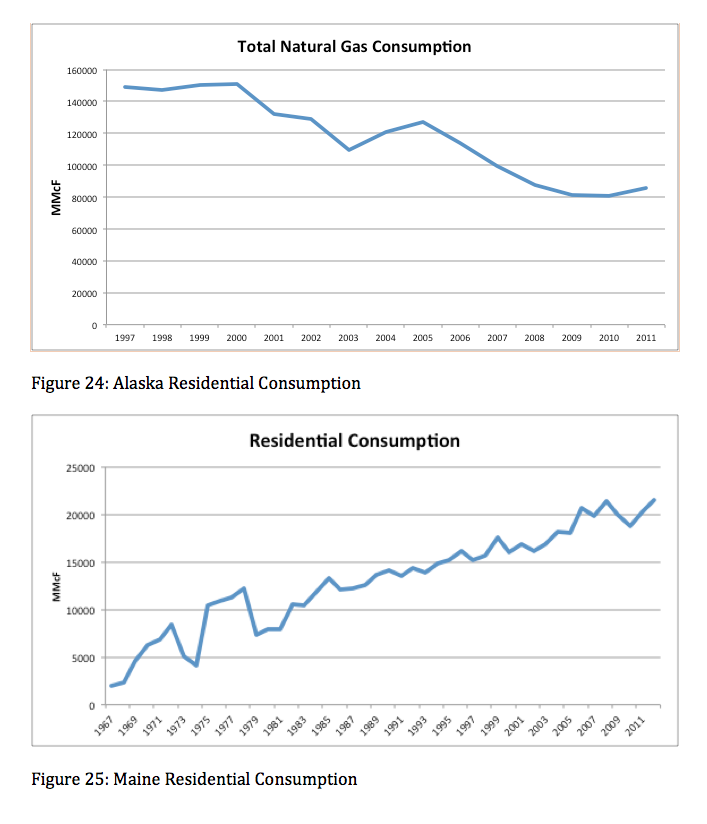
Alaska, which has only 8 programs in place, saw a sharp rise in consumption’s deviation in trend whilst heating degree-days stayed at or around trend. Total consumption stayed stagnant and residential consumption fell before rising to previous levels during the policy years (figures 23, 24).
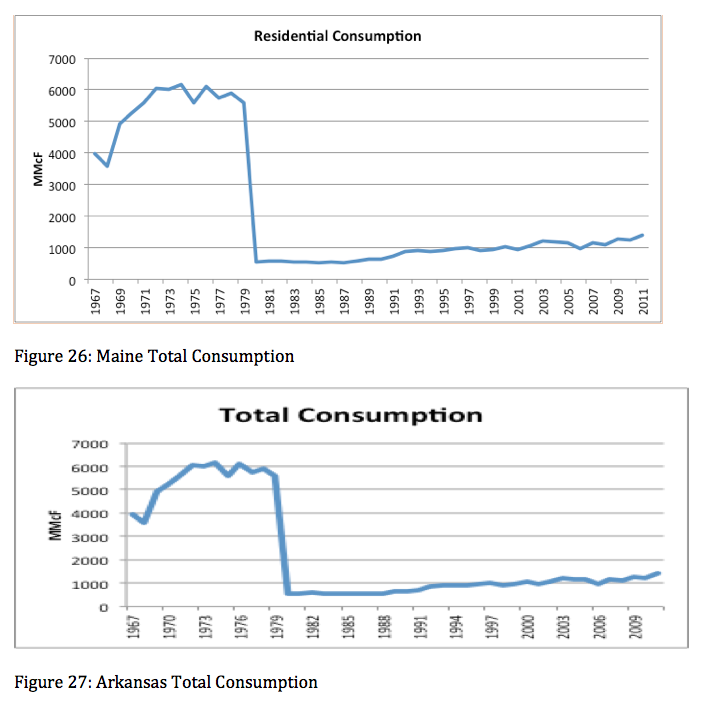
Maine did not see any drops in consumption for residential or total use during the policy years (figures 25,26) and was at or above trend during the same time period, following the trend in heating degree days closely (Figure 7). Even with 11 Policy mechanisms in place they continued to rise in consumption and keep above trend.
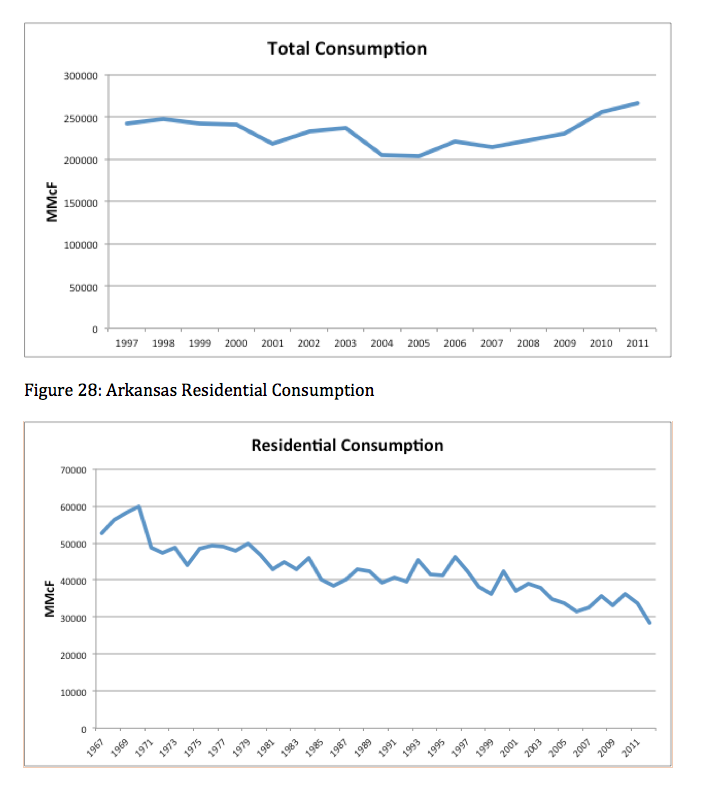
Finally, Arkansas, which had the most policy incentives out of the control group, saw total consumption rise while residential consumption fell during the years in which its policies have been in place (figures 27,28). No heating degree data was available for the years that these incentives were in place so comparisons cannot be made on that front.
Concluding Thoughts
The past four years, during which these incentives have been in place, has resulted in a sufficient amount of data to analyze the impact of how effective efficient energy incentives have been. Comparing consumption data to weather data exploited consumption patterns and gave reason to what influenced consumption of natural gas. Based on that comparison, it is clearly evident that weather patterns effect the way consumers use natural gas and most important shows when such demand patterns should exist. Deviation from the pattern would mean that another force was influencing behavior.
Determining what outside force would require comparisons to other variables. This paper used other states with different energy incentive portfolios to compare consumer demand. On the basis of the effectiveness of such portfolios, there is a lot of positive evidence suggesting that efficient energy incentives have had the effect that they were intended, that is, reducing consumption. Some states with lower amounts of incentives offered, which exhibit similar climate characteristics, as states with more incentives did not have as much or any drop in consumption while the other states did. At the very least, there was no evidence found which would suggest that incentives have not been working.
The research conducted in this paper far from proves anything. Much more research is needed to view other variables that affect consumption, such as consumer income and price of natural gas. The state of the American economy was in great disarray during this period, which is partly why so many policies were introduced to incent not just more efficient energy consumption, but also to promote the purchasing of new equipment and home upgrades to help boost the economy. Weather data for every state and every year would have been nice to compare as well, unfortunately could not be found conveniently. This paper has some worth to it; however, much more is needed to accurately decide if the policy mechanisms which have been put in place to promote efficient and green energy have had the intended effects in reduction of consumption.
References
Public Utilities Commission of California. Energy Efficiency Portfolio Plans and Program Funding Levels for 2006-2008. September, 2005.
U.S. Energy Information Administration. Maine Natural Gas Summary. October, 2013
U.S. Energy Information Administration. Minnesota Natural Gas Summary. October, 2013
U.S. Energy Information Administration. California Natural Gas Summary. October, 2013
U.S. Energy Information Administration. Florida Natural Gas Summary. October, 2013
U.S. Energy Information Administration. Oregon Natural Gas Summary. October, 2013
U.S. Energy Information Administration. Indiana Natural Gas Summary. October, 2013
U.S. Energy Information Administration. Kansas Natural Gas Summary. October, 2013
U.S. Energy Information Administration. West Virginia Natural Gas Summary. October, 2013
U.S. Energy Information Administration. Alaska Natural Gas Summary. October, 2013
U.S. Energy Information Administration. Arkansas Natural Gas Summary. October, 2013
U.S. Department of Energy. Maine Residential Energy Consumption. March, 2013
Western Regional Climate Center. Belfast, Maine: Monthly total heating degree days. October, 2012.
Western Regional Climate Center. Charleston, West Virginia: Monthly total heating degree days. October, 2012.
Western Regional Climate Center. Portland Oregon: Monthly total heating degree days. October, 2012.
Western Regional Climate Center. Anchorage, Alaska: Monthly total heating degree days. October, 2012.
Western Regional Climate Center. Minneapolis/St. Paul, Minnesota: Monthly total heating degree days. October, 2012.
University of Tennessee Knoxville. Degree Day Data: Indianapolis, Indiana. August, 1994.
University of Tennessee Knoxville. Degree Day Data: Miami, Florida. August, 1994. University of Tennessee Knoxville. Degree Day Data: Little Rock, Arkansas. August, 1994.
Database of State Incentives for Renewables and Efficiency. Minnesota Incentives/Policies for Renewables and Efficiency. June, 2012.
Database of State Incentives for Renewables and Efficiency. California Incentives/Policies for Renewables and Efficiency. June, 2012.
Database of State Incentives for Renewables and Efficiency. Oregon Incentives/Policies for Renewables and Efficiency. June, 2012.
Database of State Incentives for Renewables and Efficiency. Florida Incentives/Policies for Renewables and Efficiency. June, 2012.
Database of State Incentives for Renewables and Efficiency. Indiana Incentives/Policies for Renewables and Efficiency. June, 2012.
Database of State Incentives for Renewables and Efficiency. West Virginia Incentives/Policies for Renewables and Efficiency. June, 2012.
Database of State Incentives for Renewables and Efficiency. Kansas Incentives/Policies for Renewables and Efficiency. June, 2012.
Database of State Incentives for Renewables and Efficiency. Maine Incentives/Policies for Renewables and Efficiency. June, 2012.
Database of State Incentives for Renewables and Efficiency. Alaska Incentives/Policies for Renewables and Efficiency. June, 2012.
Database of State Incentives for Renewables and Efficiency. Arkansas Incentives/Policies for Renewables and Efficiency. June, 2012.
Database of State Incentives for Renewables and Efficiency. Glossary. September, 2010.
Appendix