Synthesis of Aspirin
Synthesis of Aspirin
By: Jon Torre
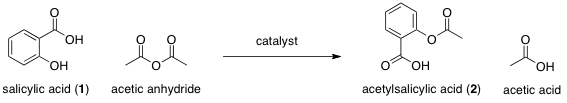
Purpose: To determine which of four catalysts yields the fastest reaction rate in the acetylation of salicylic acid (1) to form acetylsalicylic acid (2).
Reactions:
Procedure and Results:
Aspirin Synthesis Tap water was heated on a steam bath in a 250 mL beaker. The temperature of an alcohol thermometer was equilibrated in a beaker of room temperature tap water. Salicylic acid (1.00 g + 0.005 g) and acetic anhydride (2.0 mL + 0.05 mL) were added to each of four test tubes. Sodium acetate (0.20 g) was added to one test tube. The equilibrated thermometer was immediately placed into the reaction solution and the initial temperature on the thermometer was noted. Simultaneously, the START button of an Apple iPhone 4 stopwatch application was pressed. The reaction solution was stirred with a thermometer for a few seconds to ensure that all reagents and the cataylst had appropriate molecular interface. When the thermometer indicated that the reaction solution temperature had risen by 4 ˚C (+ 0.5 ˚C), the STOP button of the stopwatch application was pressed. The elapsed time was noted and recorded. This procedure was repeated using pyridine (5 drops), boron trifluoride etherate (5 drops), then concentrated sulfuric acid (5 drops) as the catalyst. The BF3OEt2, due to its toxicity, was added by the TA. After the times required for a 4 ˚C temperature increase in each reaction solution had been recorded, the reaction vessels were allowed to sit, with occasional stirring, for a few additional minutes to ensure that each reaction reached completion. The time values for each reaction were averaged with the other class values and standard deviation was calculated. Raw data used in calculations is available upon request.
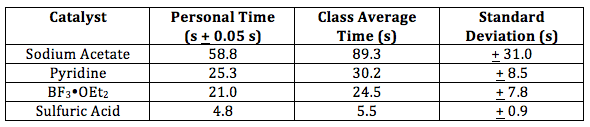
Table 1. Personal and Average times for reaction solution to increase by 4 ˚C
The test tubes were placed in the previously prepared hot water bath for 7 minutes with occasional stirring. The contents of each tube and 50 mL distilled water were then added to a 125 mL Erlenmeyer flask. Some test tubes contained polymerized product that was not added to the flask. The flask was heated for 5 minutes over a steam bath to hydrolyze excess acetic anhydride then rapidly cooled in an ice bath. Vacuum filtration through a Hirsch funnel was employed to collect the crude product of acetylsalicylic acid crystals. The crystals were rinsed with a small amount of iced tap water and dried. The filter paper and crystals were massed to determine the yield of acetylsalicylic acid. Because almost no yield was obtained, the remainder of the experiment was carried out using another classmate’s (Patrick Semesky’s) crude acetylsalicylic acid product.
Aspirin Recrystallization The crude product of acetylsalicylic acid crystals were placed in a 125 mL Erlenmeyer flask and diethyl ether, heated on a steam bath, was added drop-wise, while swirling, until all crystals had dissolved. The solution was cooled slowly to room temperature, then transferred to an ice-water bath. The flask’s contents were filtered and dried with vacuum filtration in a Buchner funnel. The mass of pure acetylsalicylic acid was determined and recorded and the percent yield of the reaction was calculated
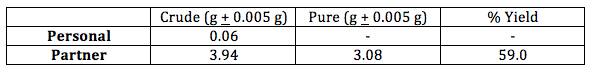
Table 2. Yield of acetylsalicylic acid. Theoretical yield for reaction is 5.22 g
Test for Phenols A small amount of distilled water (2 mL) was placed in each of 4 test tubes. and they were labeled #1 – 4. A small mass of one of four different unknown solid compounds was added to each tube. One drop of 1% iron (III) chloride solution was added to each tube and color changes were noted and recorded. The procedure was repeated using one drop of molecular iodine solution in place of iron (III) chloride solution.
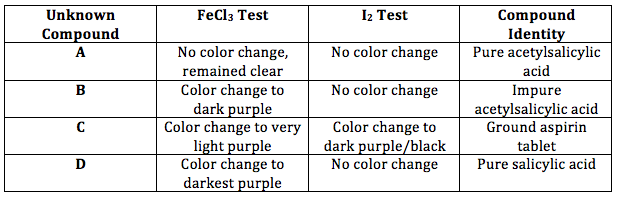
Table 3. Color changes for iron (III) chloride and iodine tests of unknowns
Discussion:
As can be seen from Table 1, sulfuric acid best increased the reaction rate of the catalysts because the temperature of the sulfuric acid-catalyzed reaction rose 4 ˚C in only 5.5 s. Therefore, sulfuric acid was the most effective catalyst, followed by boron trifluoride etherate, pyridine, then sodium acetate. Sulfuric acid increased the rate of reaction the most by reducing the energy of the reaction’s transition state(s) and thus lowering the reaction’s activation energy.
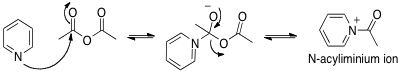
The general mechanism for catalysation by a base, like the acetate ion or pyridine, is shown in Figure 2. Bases catalyze the reaction by deprotonating the carboxyl group on salicylic acid (or the phenol group in the minor pathway), activating the nucleophile. Pyridine also activates the electrophile by reacting with acetic anhydride to form the N-acyliminium ion, as seen in Figure 3. N-acyliminium is a better electrophile than acetic anhydride due to the withdrawal of electron density from the electrophilic carbon by the nitrogen of the pyridyl ring. This is why pyridine increases the rate of reaction more so than the acetate ion.
Figure 1. The catalysts
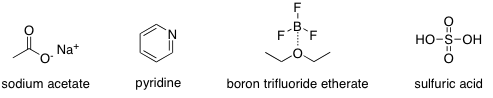
Figure 2. General mechanism for a basic catalyst (major pathway pictured)
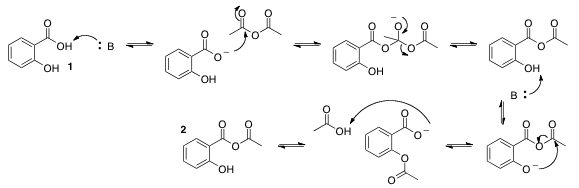
Figure 3. Formation of the N-acyliminium ion
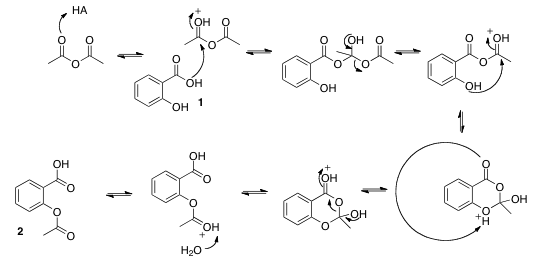
As seen in Figure 4, the general mechanism for catalyzation by an acidic species such as boron trifluoride or sulfuric acid involves the protonation of the electrophile, increasing its electrophilicity. The protonated oxo group withdraws even more electron density from the electrophilic carbon atom, increasing the likelihood that it will be nucleophilically attacked. Though the general mechanism uses a Bronsted acid as the catalyst, the mechanism is analogous with a Lewis acid (such as BF3), though instead of a proton, the oxo group will be coordinated by a different electron deficient center (such as the unfilled p orbital of a boron atom).
Acids, unlike bases, catalyze the reaction at multiple steps because the acid’s proton is transferred around the molecule. This increases propensity for nucleophilic attack and leaving group bond cleavage several times rather than just one. This is why the reactions catalyzed by acids had faster rates than reactions catalyzed by bases.
Figure 4. General Mechanism for an acidic catalyst
The personal times measured for the rise in temperature are relatively accurate in relation to the class average results, as the recorded times fall within one standard deviation of the mean. It is important to note, however, that the standard deviation of the sodium acetate – catalyzed reaction (31.0 s) is quite large and that the personal value is only just inside one standard deviation. The sodium acetate experiment is the trial that all members of the class performed first, so their techniques were not yet refined. This might explain the large data spread. Members of the class may have also utilized different techniques to measure the time taken for a 4 ˚C temperature change to occur. This is a possible source of error that would lead to a less consistent time and wider data spread/greater standard deviation.
Monitoring the rate of a reaction via temperature change is not the most accurate method of measuring reaction rate because it is so indirect. The definition of rate of reaction is the change in concentration of products over the change in time (∆[P] / ∆t). To most directly measure rate, the concentration of a product should be measured periodically over time. While heat energy is technically a “product” of an exothermic reaction, it has no concentration so a specific rate cannot be determined. Additionally, the exothermic reaction of salicylic acid acetylation is not the sole process influencing the temperature, as the method assumes. Salicylic acid and acetic anhydride have heats of solvation in water, so aqueous catalyst would change the reaction’s rate of temperature change relative to the non-aqueous catalyst even if the catalysts were equally effective. Enthalpies of other side reactions, such as the polymerization of salicylic acid may have also contributed to the temperature change, corrupting the data. Exothermic side reactions would increase the reaction temperature more quickly even if the salicylic acid acetylation rate had not changed. Endothermic side reactions would retard the rate of temperature increase.
The personal yield was nearly zero, likely due to side reactions. Some test tubes developed into a gummy polymer of salicylic acid, likely because they were heated for too long. This polymer was not transferred to the solution with water, reducing yield. Prolonged contact with acid catalyst in the presence of water can lead to regeneration of salicylic acid starting material and reduce acetylsalicylic acid yield.
The theoretical yield of 5.22 g acetylsalicylic acid was stoichiometrically determined using the starting mass of salicylic acid (4.0 g) because it was the limiting reactant. Acetic anhydride was used in excess so that salicylic acid and acetylsalicylic acid could be directly stoichiometrically compared and because acetic anhydride is easily hydrolyzed by water and lost. This would reduce yield and shift equilibrium toward the reverse reaction. The partner’s yield, as seen in Table 2, was 59.0 %. This is a relatively high yield and any error can be accounted for by the incomplete reaction of the reactions, side reactions, or loss molecules through poor recrystallization, spills, or solution left in beakers, etc.
The purification technique of recrystallization is very effective, as long as the temperature is lowered slowly enough that very pure crystals are formed. Immediately plunging the hot ether solution into an ice bath would precipitate large, impure crystals. The efficacy of the recrystallization could have been analyzed by determining the melting point range of the acetylsalicylic acid. A small melting point range close to the standard of acetylsalicylic acid would suggest a high purity sample, meaning the recrystallization process was effective. A large melting point range would suggest an impure sample and ineffective recrystallization process. In this lab, for recrystallization, the solution was allowed to cool to room temperature very slowly, but was then plunged rapidly into ice water. This second step rapidly precipitated large crystals, likely leading to high impurity. The sample should have been slowly cooled to 0 ˚C by placing it in a refrigerator and slowly lowering the temperature. The melting point of pure acetylsalicylic acid is 135 ˚C1. An experimental melting point range of 134 – 136 ˚C or narrower would suggest that the recrystallization procedure was sufficiently effective.
Iron (III) chloride can be coordinated and then reduced by deprotonated phenol. The produced (PhO)2Fe(II) species is a dark purple color, the presence of which indicates the presence of phenol functional groups in an unknown compound. The intensity of the purple color corresponds with the concentration of phenol functional groups present. Four unknown compounds, A, B, C, and D, were provided and each was one of: pure salicylic acid, impure acetylsalicylic acid, pure acetylsalicylic acid, or ground aspirin tablet. Unknown compound D was determined to be pure salicylic acid because it had, qualitatively, the darkest, strongest purple color, as can be seen from Table 3. Compound A was determined to be pure acetylsalicylic acid because it underwent no color change and thus contained no phenol groups. Compounds B and C both experienced a color change, though B experienced a stronger one, so it was not possible to distinguish them using the ferric chloride test alone.
To test for the presence of starch, iodine solution was added. Starch is present in aspiring tablets to bind the medicine together. Iodide ions infiltrate the helical chain of long starch molecules, turning the solution dark purple/black in the presence of amylose2. Unknown compound C was the only unknown that underwent a color change when treated with iodine solution, meaning compound C was determined to be ground aspirin tablet even though there was some concentration of phenol present. Thus, unknown compound B was determined to be impure acetylsalicylic acid.
These two qualitative tests could be improved by making them quantitative tests. A spectrophotometer could have been employed to measure the absorbance values at 415 nm wavelength. Lower absorbance values would indicate that a greater concentration of phenol was present and the absorbance value could be used to directly determine the concentration
1 Cappelli, G. J. Chem. Indus. App. 1920. 2, 291-300
2 R.E. Rundle, J. F. Foster, R. R. Baldwin. J. Am. Chem. Soc. 1944. 66, 2116 – 20
