Synthesis of & Reversing O2 Addition on Vaska’s Complex
Synthesis of & Reversing O2 Addition on Vaska’s Complex
By Ellie J. Miller
Abstract:
This lab illustrates the synthesis of Vaska’s complex. It then shows the reversible process of binding oxygen gas (O2) to Vaska’s complex through IR spectroscopy. Oxygen gas can be bound to the complex via oxidative addition but through the reverse process it can be stripped from the complex by purging the system with nitrogen gas as detailed in this report.
Introduction:
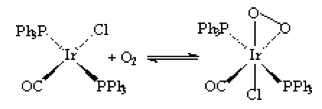
Vaska’s complex (trans-IrCl(CO)(PPH3)2) has an iridium center with trans -PPh3 ligands, -CO ligand, and -Cl ligand. The -Cl can be stripped off and O2 added via oxidative addition in presence of oxygen gas. However, this is a reversible process as shown by the equilibrium arrows in the diagram below.
This process of adding oxygen to the complex in known as the activation of oxygen. It can be observed by the intensity of peaks in IR spectroscopy1. The peaks of the oxygenated species will be a slightly smaller frequency that the peak of the complex without oxygen.
Experimental:
Part 1: Synthesis of Vaska’s Complex
In a 50mL round bottom flask, (0.1062g, 3.0117×10⁻⁴mol) IrCl3H2O, (0.3984g, 1.5189×10⁻³mol) PPh3, (10mL, 0.12916mol) dimethylformamide, and (0.120mL, 1.314×10⁻⁴mol) aniline were measured and added together. A stir bar was added and the flask was fitted with a reflux condenser. A gas adapter was added to the top of the condenser and the system was purged with nitrogen for approximately ten minutes. The flask was then suspended in an oil bath to reflux at 165 for two hours under a nitrogen atmosphere. Following reflux the flask was allowed to cool to below 50, then 30mL of the ethanol was added. The flask was then transferred to a 100mL Erlenmeyer flask and placed in the freezer to crystallize. After approximately one week the flask was removed from the freezer and filtered via vacuum filtration, a yield of 77.0mg was recorded. An IR spectrum of the solid Vaska’s complex was then taken. That spectrum is shown below.
IR 1: IR Spectrum for Vaska’s Complex
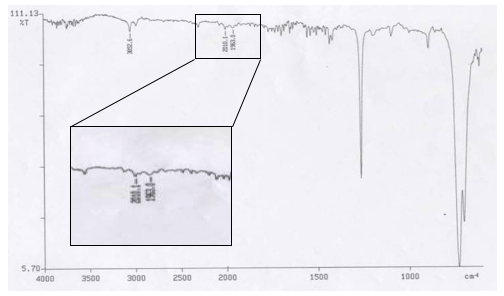
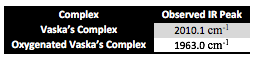
Table 1: IR Peaks from Vaska’s Complex Spectrum
Part 2: Reversing Oxygenation of Vaska’s Complex
In a small glass vial (40.5mg, 5.1906×10⁻⁵mol) Vaska’s complex crystals from Part 1 were weighed out, 15mL of toluene was then added to the vial with a small stir bar. A septa cap was then placed on the vial. A vent needle was inserted and the nitrogen stream was inserted so that the tip of the nitrogen needle was below the surface the solution. Nitrogen gas was then sparged through the solution for thirty minutes. Following this the nitrogen line was removed as was the vent needle. The vial was then placed on a stir plate to stir at a high rate (~700rpm) for approximately forty-five minutes. The toluene was then removed from the system using the trap. The product was then scraped from the flask to obtain another IR.That spectrum is shown below.
IR 2: IR Spectra of Vaska’s Complex following Reverse of Oxygenation
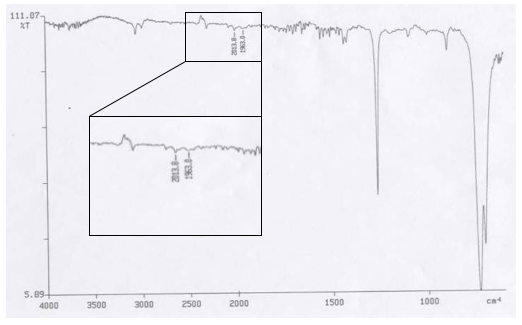
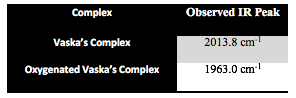
Table 2: IR Peaks from Vaska’s Complex following Reverse of Oxygenation
Discussion:
The IR of the Vaska’s complex product (IR 1) showed that in the process of crystallizing the complex had already partial oxygenated, this was evident from the peaks in Table 1. The peak at 1963.1cm-1 is the oxygenated species, while the peak at 2010.0 cm-1 is Vaska’s complex without oxygen. Given that complex was already oxidized Part 2 attempted to reverse the reaction and removed the oxygen from the complex. The second IR following Part 2 (IR 2) showed that reverse process was successful. There were very small intensity changed in comparing the IR peaks from both spectrums.
The premature addition of oxygen to Vaska’s complex is simply exposure to oxygen in the air while the solution from Part1 was crystallizing over the course of a week. Perhaps, if the crystals had been filtered from the solution soon that could have been avoided. However, as the process is reversible Part 2 is did prove this. The IR spectrums did show small intensity changes from Part 1 to Part 2. This shows that reversing the reaction using nitrogen was success. Due to the small change it can be assumed that very little of the complex was stripped of the oxygen. This could be due to amount of time the solution was purged with nitrogen and allow to stir in Part 2. If the solution had been left to stir for ninety minutes or longer there may have been a more quantifiable intensity difference in the two Vaska’s Complex IR spectrums.
References:
- Vaska, L.; DiLuzio, J.W. J. Am. Chem. Soc. 1961, 83, 2784.
