Titration of an Unknown Acid
Introduction:
In this lab, the identity of an unknown acid was determined through the laboratory process titration. By continuously adding a strong base, sodium hydroxide (NaOH), to a solution of unknown acid and plotting the gathered data, the dissociation constant (pKa) of the unknown acid could be determined. The purpose of the lab was to strengthen our understanding of the basic properties of acids and bases by observing how acid-base reactions affect the distribution of elements of water at equilibrium.
Materials and Methods
To carry out this lab, we began by calibrating a pH meter (Orion model 250A(?)) using 4.01, 7.00 and 10.00 buffer solutions. The acid solutions for both parts of the experiment were measured to be 40 mL, placed in a beaker containing a stir rod and put atop a stir plate. A pH electrode (Orion Triode- model 9107BN) was placed into the beaker.
The first objective was to determine the concentration of the strong base, sodium hydroxide (NaOH), by continuously dispensing small amounts of it from a 50 mL burette into a beaker containing the weak acid solution of 0.1 M potassium biphthalate (C8H5KO4.) By plotting the changing pH of the mixture against the volume of NaOH dispensed, we obtained a titration curve. Through a couple calculations, we were able to determine the concentration of the NaOH. Once the concentration of the base was determined, we repeated the same procedure with 40 mL of unknown acid. Based off the pH’s obtained from the titration of the unknown acid, a pH vs. volume graph was generated in which the pKa of the unknown acid was interpreted.
When the pH was being recorded, the electrode usually reached a steady value within several seconds. However, when it took longer to reach this steady value, we chose an allotted amount of time (30 seconds) to wait before recording the pH. This amount of time allowed for the solution to be properly mixed but was not long enough to allow the exchange of atmospheric gases.
Results
Standardization of the Strong Base Titrant. In order to titrate the potassium biphthalate, 37.0 mL of NaOH was dispensed (Figure 1).
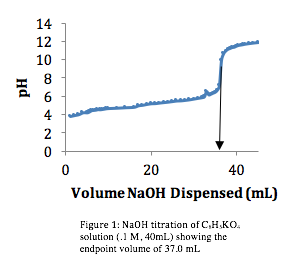
Because we knew the concentration of the potassium biphthalate ,.1 M, we were able to use the equation:
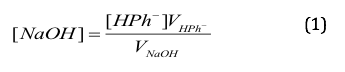
where VHPK is the volume of the potassium biphthalate (40 mL) and VNaOH is the volume of NaOH required (37 mL) to determine the concentration of the NaOH. Using that information, we calculated [NaOH] to be 0.1081 M.
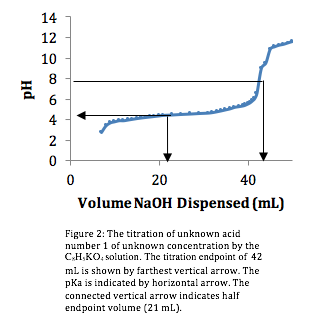
Titration of the Unknown Acid. Using the same procedure and graphing the titration curve (Figure 2), we found the endpoint to be 42 mL.
Discussion
Within the laboratory instructions, there was a list compiled of potential weak acids our unknown solution could be: acetic, boric, tartaric and phosphoric acids. In analyzing the titration curve for the unknown acid (fig. 2), we were able to see that unknown acid deprotonated only once, indicating that our unknown acid was a monoprotic acid, thusly eliminating, phosphoric and tartaric acid as possibilities. Of the remaining acids, boric and acetic, we could immediately eliminate boric acid because of its high pKa1 of 9.24, therefore the unknown acid was acetic acid.
In order to confirm that our unknown solution was acetic acid, the pH value at one-half of the endpoint volume (42 mL) would be the pKa value of acetic acid. Looking at figure 2, the arrow pointing to the y-axis indicates that at half of the endpoint volume (21 mL) the pH is 4.3. This value correlates closely to the given pKa value of acetic acid, 4.79, listed on the laboratory handout.
Knowing that our solution was acetic acid, we could calculate its concentration. Figure 2 indicates that acetic acid is a monoprotic acid. With the endpoint at 42 mL, the acetic acid (CH3CO2H) concentration is given by
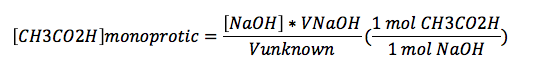
where [NaOH]=0.1081, VNaOH=42 mL, and Vunknown=40.0 mL. For these values, [CH3CO2H] is 0.113505.
Evaluation
This lab was rather tedious yet straight forward and easy to complete. The processes of the experiment readily explain the process of titration. Graphs generated from the acid titrations help illustrate equivalence points for titrations.
