Vapor Pressure of a Pure Liquid
Abstract:
The enthalpy of vaporization, entropy of vaporization at 298 degrees Kelvin, and the compressibility factor of Heptane were determined by measuring the vapor pressure of the liquid at varying temperatures. The enthalpy of vaporization was 26.77 ± 0.52 (kJ/mol). The entropy of vaporization at 298 K was 89.8 ± 1.7 (J/K mol). The compressibility factor was 1.31. The literature value for the enthalpy of vaporization was 35.07 (kJ/mol). The literature value for the entropy of vaporization at 298 K was 117.7 (J/K mol).1
Introduction:
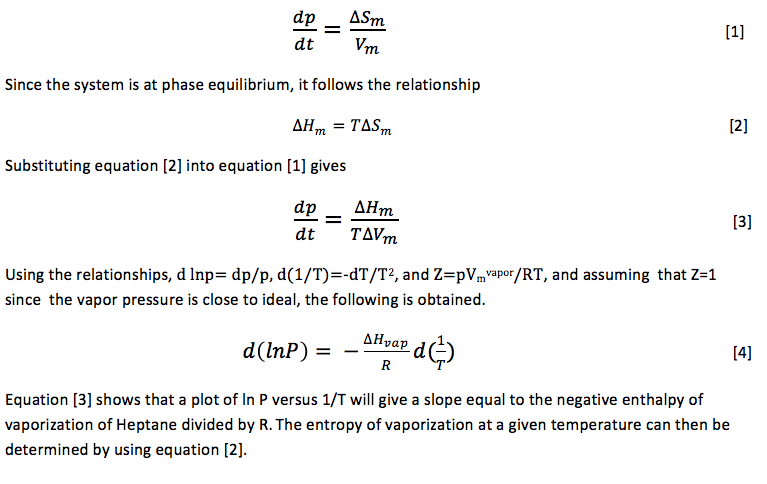
Determining the vapor pressure of compounds, such as pesticides, is used in order to understand the distribution of these chemicals into the environment. 2 Knowledge of the vapor pressure of salt water solutions is important due to the frequent use of water in industrial systems and its importance in Biological systems.3 Knowledge of the thermochemical properties of Heptane are needed because of the chemicals use in fuel and petrochemical industries.4 A system that is composed of a pure liquid in coexistence with its vapor at a fixed temperature and pressure which contains no other gases present in the vapor phase has a pressure known as orthobaric pressure. The rate of vaporization of the liquid is equal to the rate of condensation because the liquid and vapor coexist. All one-component phase equilibrium systems follow the relationship
Methods and Materials:
A large beaker of water with a stir bar was filled with water and placed on a stirring hot plate, creating a water bath. The water bath was stirred slowly and a thermometer was placed inside the water bath. Ice was added to the bath until a temperature below 10 degrees Celsius was reached. Heptane (Fischer, 98%) was added to the isoteniscope until the bulb of the isoteniscope was approximately two thirds full. The Isoteniscope containing heptane was then placed inside the water bath and connected to a ballast bulb (Eyela, A-1000) and vacuum gauge (Vacuubrand, DVR2). The isoteniscope was then clamped in place using a ring stand. Air was removed from the isoteniscope by pumping air out of the system for about 10 minutes. Air is then added to the isoteniscope so levels of liquid in the U-tube portion of the isoteniscope are equal. The temperature and pressure of the system were recorded. The system was heated and readings of pressure and temperature were taken in increments of 5 degrees Celsius. Levels of liquid in the U-tube were kept constant at all times by subsequently adding air or using the vacuum to adjust the levels in either direction.
Results:
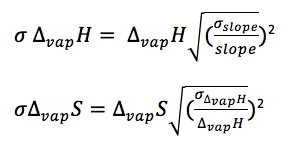
Figure 1 shows the change in the natural log of pressure as a function of the inverse of pressure. As described by equation [4], the slope of this graph will be equal to the negative of the enthalpy of vaporization divided by the rate constant. The enthalpy of vaporization can then be used to determine the entropy of vaporization at any given temperature by using equation [2]. The compressibility factor is determined by dividing the literature value for enthalpy of vaporization by the experimental value for enthalpy of vaporization. The error in the enthalpy of vaporization was determined by a linear regression using excel. The error in the entropy of vaporization was determined using propagation equations listed in the Appendix.
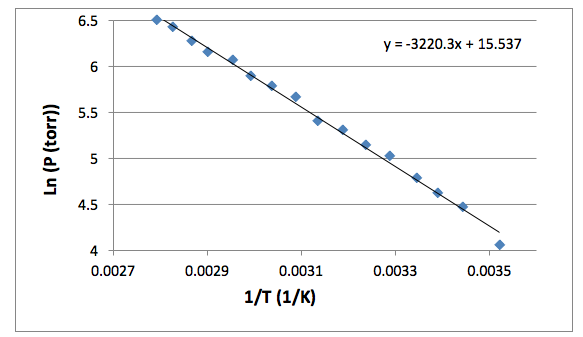
Figure 1: The natural log of Pressure is plotted against the inverse of temperature. The slope of this line is equal to the negative enthalpy of vaporization divided by the gas constant. The resulting enthalpy of vaporization was 26.77 ± 0.52 (kJ/mol).
Table 1: Experimentally determined values for enthalpy of vaporization, entropy of vaporization at 298 degrees K, and for the compressibility factor.

Conclusion:
There were moderate errors in both the entropy and enthalpy of vaporization when compared to the literature values. The calculated indeterminate errors were low so the errors did not come from imprecise measurements. The determinate error may in part be due to the Heptane being only 98% pure. While we were not aware of any problems at the time of the experiment, there is a chance that additional contaminants were introduced into the solution or were present in the apparatus. A more thorough cleaning of the isoteniscope and of the entire apparatus would likely lead to more accurate results.
Appendix A: Raw Data
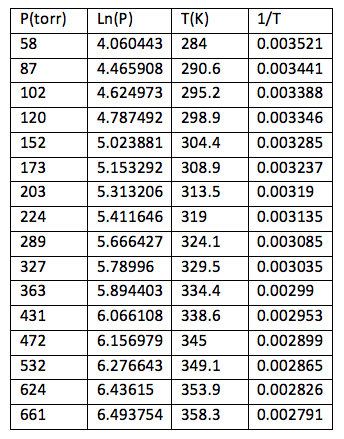
Table 2: Pressure and temperature measurements
Appendix B: Error Equations
References:
- National Institute of Standards and Technology. http://webbook.nist.gov/cgi/cbook.cgi?ID=C142825&Mask=4 (Accessed March 2014)
- Goodman, M. Vapor Pressure of Agrochemicals by the Knudsen Effusion Method Using a Quartz Crystal Microbalance. J. Chem. Eng. Data. [online] 1997, 42, 1227-1231.
- Mato, F.; Cocero, M. Measurement of vapor pressures of electrolyte solutions by vapor pressure osmometry. J. Chem. Eng. Data [online] 1988, 33, 38-39.
- Weber, L. Vapor pressure of Heptane from the Triple Point to the critical point. J. Chem. Eng. Data. [online] 2000, 45, 173-176.
- Hagen, J.; Vapor Pressure of a Pure Liquid; http://chemweb.calpoly.edu/jhagen/Vapor_Pressure.pdf
