Water Treatment Design
Problem Statement
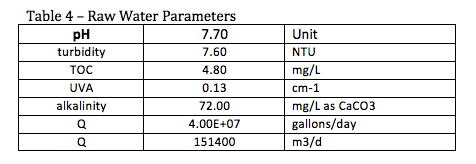
Design a drinking water treatment plant to treat 40 million gallons per day. The design includes one conventional surface water treatment plant that complies with current regulations, and two alternative treatment plants that comply with future regulations. The treatment plant is designed to treat water with the characteristics shown in Table 1.
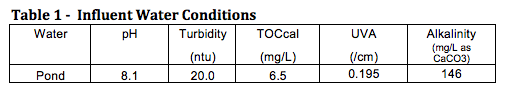
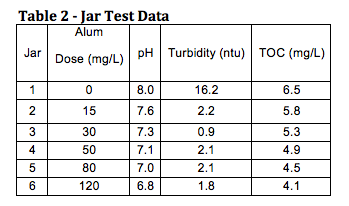
A jar test was performed on the raw water, with the results shown in Table 2. For TOC removal, the jar test data was not used in favor of the water treatment plant model program.
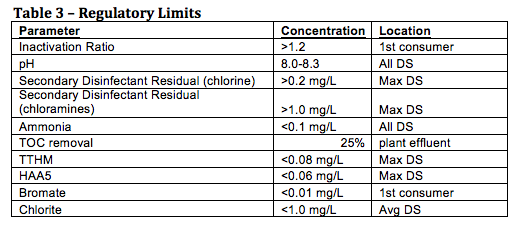
The plant must abide by the regulatory constraints in Table 3.
Plant design
The plant is designed such that if any treatment train assuming that if one were to go offline, the remaining three would be able to accommodate the 151400 m3/ day flow. Additionally, if any treatment process goes down, water from one treatment train can be routed to another treatment train through a network of couplings upstream of each process.
Raw water enters the conventional treatment plant at 40MGD and is divided into 4 parallel treatment trains. The water is dosed with alum in a rapid mixing tank, and then flows to the tapered flocculation tank. To minimize velocity gradient after flocculation, a large diameter pipe carries the water to a circular sedimentation tank. The water is then run through a dual media anthracite-sand filter and then dosed with chlorine. Adequate primary disinfection occurs in the baffled clearwell and the water maintains residual disinfection throughout the distribution system. Figure 1 shows all treatment processes in parallel.
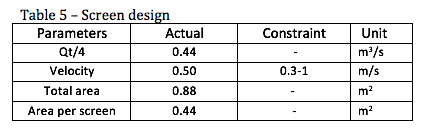
Screening
Screen size was determined by using an average acceptable loading velocity of 0.5m/s. There are two screens in parallel per treatment train. Table 5 shows screening parameters and specifications.
Chemistry
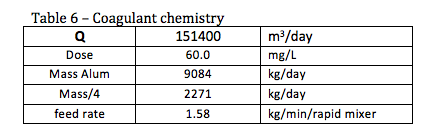
Jar test data dictated an alum dose of 50 mg/L; however, in order to reduce TOC and aid in disinfection, the alum dose was increased to 60 mg/L for the base plant and it was calculated that each of the four trains in the plant would receive 1.58 kg/min of coagulant. Coagulant dosage it shown in Table 6.
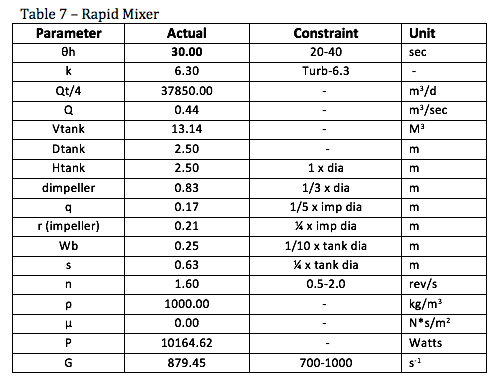
Rapid Mixer
The rapid mixer was designed with an assumed residence time of 30 seconds. It is designed as a circular, baffled tank with a 6 blade turbine mixer. The power required for this mixer, roughly 10,000 Watts, was calculated based on typical values for impeller dimensions and baffling and the characteristics of water. The velocity gradient, 880 s-1, provides good mixing and allows for an increased loading rate in case water needs to be routed from another treatment train. Rabid mixer design specifications are given in Table 7.
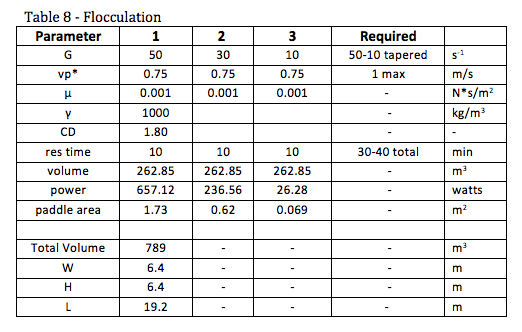
Flocculation
After mixing, the alum causes flocculation of particles in the water. Three horizontal paddle mixers facilitate flocculation. It was decided to use three tanks to minimize cost, and the velocity gradient for each tank was selected from the range of typical values. For simplicity, the flocculators utilize constant paddle velocity with varying paddle area. The tank sizing is based off the necessary residence time and the typical length to width to height ratios as well as our flow. Flocculator parameters are shown in Table 8.
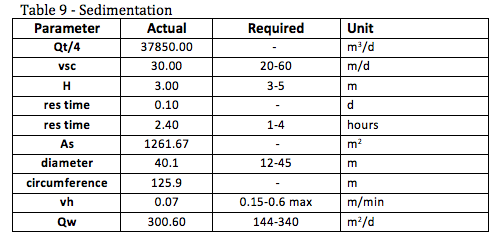
Sedimentation
After flocculation, the water flows to the settling basins to allow the flocs to continue forming and then the settle where they can be removed as sludge. The flocculated water flows through large diameter pipes in order to minimize energy input and maintain floc integrity. The settling velocity and height of the tanks were selected based on the type of particle we expected and the range of typical settling velocities. The size of the tanks were calculated based on the residence time needed to settle out the particles moving at the chosen settling velocity. The settling tanks are circular and the dimensions calculated based on typical values and the minimum dimensions which would satisfy the conditions for particle settling. Sedimentation tank parameters are shown in Table 9.
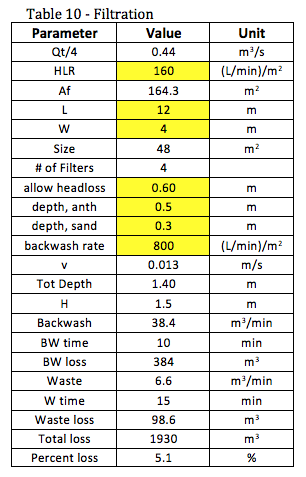
Filtration
Filtration consists of dual media filters with anthracite and sand chosen for their efficiency. Most of the dimensions and volumes for the filtration tanks and media were selected from the range of typical values with our particular requirements in mind. Backwash was calculated from assumed backwash rate and the size and flow of the filtration tanks. Filter parameters are shown in Table 10.
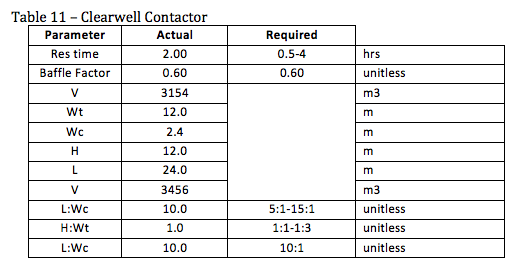
Disinfection
Sodium chloride is added to the filtered water and contact time is facilitated through a baffled clearwell/contactor. The contact time allows for primary disinfection while leaving a chlorine residual in the water at all points in the distribution system assuming a 5 day maximum residence time. Clearwell design parameters are shown in Table 11.
Base plant design and water quality summary
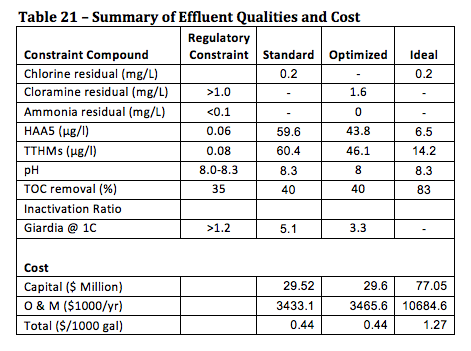
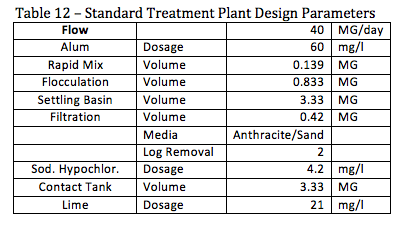
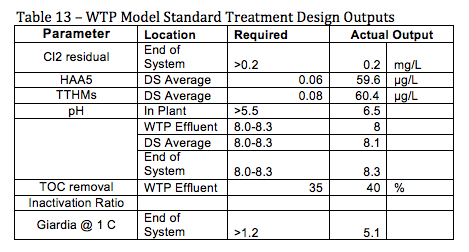
The largest hurdle in designing the base plant was finding a way to limit Haloacetic acid (HAA5) formation and maintain the minimum 0.2mg/l chlorine residual. Several other factors played into the initial design. Dosing of lime helped increase the effluent pH, however the lime effectively increased chlorine demand. To cope with these constraints, the alum dose was increased to reduce NOM in the effluent, reducing DBP formation. The volume for each stage of the treatment process as well as the chemical doses necessary to meet the water quality standards are shown in the table below. Table 12 gives a summary of the plant design and chemical doeses. Table 13 shows the standards for the plant effluent and expected effluent quality.
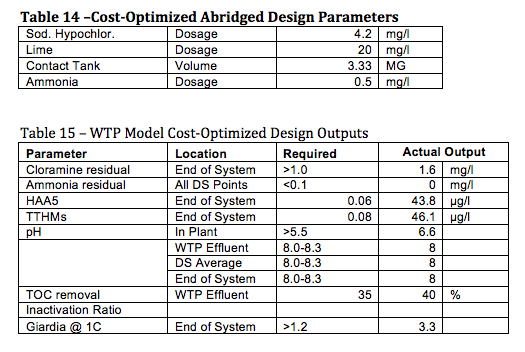
After designing the base case plant, two optimized plants were designed to limit the parameters that were uncomfortably close to their maximum contaminant levels, namely HAA5 and TTHM. The most cost effective way to reduce DBP formation was to introduce ammonia to the system and lend the disinfection responsibility to chloramines. This was good choice as it, lowered the formation of DBP’s by 25%, while only increasing the capital cost by 0.3% and O&M by 0.94%. Fine-tuning the dosing of ammonia led us to the parameters shown in Table 14 and Figure 2.
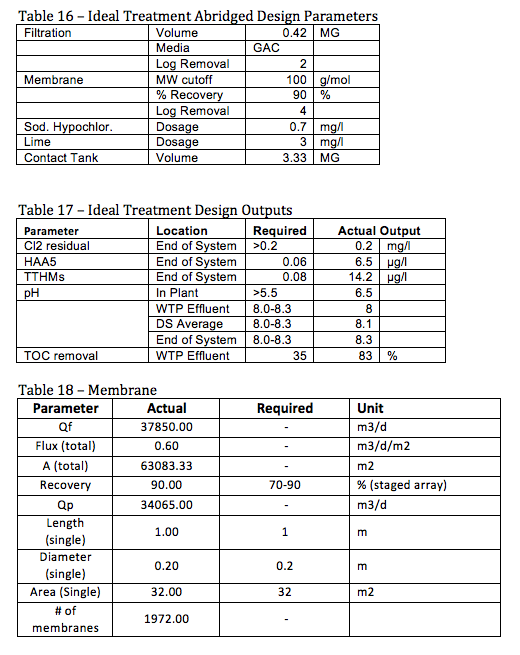
If perfect water quality was of the utmost and money was not a constraint, it was decided that the ideal future design would entail a membrane filtration system after media filtration. Since it would still be treating pond water, it was in no way necessary to desalt the water; therefore it maintained a system recovery of approximately 90%, with a 4 log removal of microorganisms. This lowers the DBP formation immensely, while in turn reducing the dosing of all chemical additives. The flow of the ideal treatment plant can be seen with all the new additions in Figure 3. The following are the parameters and outputs of said system are given in Table 16.
Summary
There was a very sensitive balancing act between the drinking standards and desirability while using the modeling program to develop the disinfection designs with varying parameters. Lack of acclamation to the variables affecting the required standard delayed our progress immensely. After several trials and errors, the interaction between each stage was realized and used to improve effluent quality. The standard water treatment doses were determined by trying to meet given constraints at the average as well as end points of the distribution system. The cost optimized system is very similar, since the base case was so inexpensive and the raw water quality was relatively good. It was decided that chloramines were more desirable as a secondary treatment since they do not contribute to the DBP levels. This decision required the addition of ammonium in the system, changed where the chlorine was added, and lowered the amount of lime necessary to maintain the pH. For the ideal system, a membrane system was chose based solely on the fact that it removes the majority of contaminants, especially DBP causing organic matter.