Synthesis of 4-bromochalcone & 3-(4-bromophenyl)-5-phenylisoxazole
Written by: Ryan Castellente
Abstract
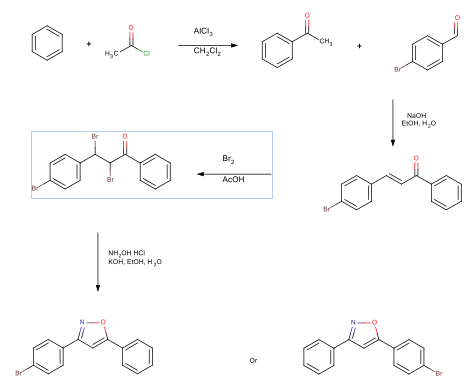
An acylation reaction was performed reacting benzene with acetyl chloride, resulting in the 61% yield of acetophenone. An aldol condensation reaction reacted the acetophenone with 4-bromobenzaldehyde. This reaction produced 65% yield of 4-bromochalcone. A bromination reaction was performed on the 4-bromochalcone, resulting in a 76% yield of 2,3-dibromo-3-(4-bromophenyl)-1-phenylpropan-1-one. The final reaction formed an isoxazole ring, resulting in a 95% yield of 3-(4-bromophenyl)-5-phenylisoxazole. The synthesis scheme is seen below.
Introduction
Isoxazoles have been of interest to many chemists for many years. Although still relatively new, chemists are finding many different uses for these types of compounds. One use of isoxazoles are as herbicides. From a patent for a 4-substituted isoxazole herbicide, these compounds are able to inhibit the growth of certain plants . Another interesting use of these compounds is in the medical field. A 3-unsubstituted isoxazole ring is found in the anti-inflammatory drug leflunomide. Studies have been conducted on the N-O bond cleavage to try to determine what about this ring opening gives rise to its anti-inflammatory properties . These are only two of the many uses of this group of compounds.
Contents
Abstract
Introduction
Equipment and Reagents
Experimental
Acylation
Chalcone Preparation
Chalcone Dibromide Preparation
Isoxazole Preparation
Results
Benzene
4-bromobenzaldehyde
Acetophenone
4-bromochalcone
Dibrominated Chalcone – 2,3-dibromo-3-(4-bromophenyl)-1-phenylpropan-1-one
Final Product – 3-(4-bromophenyl)-5-phenylisoxazole
Appendix #1
Appendix #2
Appendix #3
Appendix #4
Appendix #5
Equipment and Reagents
The masses of the compounds in the synthesis were obtained using a Mettler AE 163 analytical balance. IR spectra were acquired using a Thermo Nicolet 380 FT-IR with diamond ATR accessory.
A Bruker Avance 400 was used to run proton and carbon-13 NMR, DEPT, COSY, and HETCOR of the samples using the standard operating procedure . Each sample analyzed in this experiment was diluted in chloroform-d (Acrōs organics, 99.8%, CAS No. 865-49-6) with TMS added. 4-Bromobenzaldehyde (Sigma Aldrich, CAS No.1122-91-4) and benzene (Sigma Aldrich, CAS No. 71-43-2) were obtained and characterized by NMR, setting the instrument to 4 scans for the proton NMR and 64 scans for the carbon-13 NMR. The proton NMR of the acetophenone was process with 4 scans, the carbon-13 and the DEPT with 32 scans each, and the COSY and HETCOR with 8 scans each. The proton NMR of the chalcone was processed with 4 scans, the carbon-13 and the DEPT with 256 scans each, and the COSY and HETCOR with 8 scans each. The proton NMR of the dibrominated chalcone was processed with 4 scans, the carbon-13 and the DEPT with 256 scans each, and the COSY and HETCOR with 8 scans each. The proton NMR of the isoxazole was processed with 200 scans, the carbon-13 and the DEPT with 1280 scans each, the COST with 24 scans, and the HETCOR with 48 scans.
A Hewlett Packard 5989B mass spectrometer was used to acquire a mass spectrum of the samples to analyze the structural makeup and the atoms present in each product. Each sample was dissolved in methanol in order to be injected into the instrument. NIST MS Search 2.0 was used to perform a library search of the compound from the mass spectrum data.
Experimental
Acylation
The week before, the appropriate glassware was set in a drying oven to remove any moisture. The apparatus in Figure 1 was assembled.
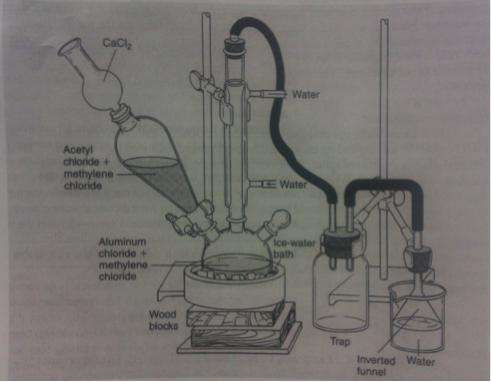
Figure 1: Apparatus for Friedel-Crafts acylation3
In a hood, 14.2 grams of aluminum chloride (Fluka CAS No. 7446-70-0) was weighed out. The aluminum chloride was transferred into the 500mL three-necked flask and 15 mL dichloromethane was used to transfer any remaining traces and rinse the neck of the flask. A stir bar was added to the flask and the stopper was replaced. A steady flow of water was circulated through the condenser throughout the reaction. The three-necked flask was lowered into an ice/water bath on a stirring plate. Approximately 7.25 mL of acetyl chloride (Sigma-Aldrich, CAS No. 75-36-5) and 15 mL of dichloromethane were transferred to the addition funnel. The acetyl chloride solution was slowly added over twenty minutes to the aluminum chloride. Using a syringe, 6.6 mL of benzene (Sigma-Aldrich, CAS No. 9072-35-9) was extracted from its container and combined with 10 mL of dichloromethane. The benzene solution was then transferred to the addition funnel. The addition into the acylation mixture was started and slowly added over the next half an hour. After the addition was completed, the reaction mixture was removed from the ice-bath and left at room temperature for thirty minutes.
In a 400 mL beaker, 25 mL of concentrated hydrochloric acid was added to approximately 50 grams of ice. The three-necked flask was removed from the apparatus and its contents were added to the mixture. The mixture was then transferred into a 250 mL separatory funnel and allowed to separate into layers. The bottom, organic layer was separated into a beaker. An additional 30 mL of dichloromethane was added to the aqueous layer in order to fully extract the remaining organic material. The bottom organic layer was again extracted and the two organic layers were combined. The organic layer was then slowly washed with a saturated sodium bicarbonate solution, quenching any remaining reaction. The mixture was added to a 125 mL separatory funnel, which was mixed and vented until carbon dioxide emission ceased. After the layers had again separated, the organic layer was extracted into a beaker and dried over granular anhydrous sodium sulfate.
The product decanted from the drying agent and transferred to a 250 mL round bottom flask. The dichloromethane was removed by rotary evaporation on a BUCHI Rotavapor R11.
Purification by Column Chromatography
The product was purified by the column chromatography . A column with a diameter of 35 mm and a height of 280 mm was selected and packed with approximately 300 g of silica gel .
The impure acetophenone was added to the top of the column. A beaker was used to collect 275 mL of solvent. Five 50 mL fractions were collected, and tested by TLC for the elution of the acetophenone. The fifth collection resulted in a spot indicating the presence of the pure acetophenone. Fractions of 10mL were collected and tested with TLC until the spots tailed off and disappeared. The column was stopped and the fractions containing acetophenone were combined. The additional mobile phase was removed by rotary evaporation. Experimentally, the step produced a percent yield of 61%.
Chalcone Preparation
In a 125 mL Erlenmeyer flask, 1.0 grams of sodium hydroxide (EMD, CAS No. 1310-73-2) was dissolved in 15 mL of DI water. A stir bar and 12 mL of ethanol (190 Proof, Pharmco-AAPER, CAS No. 64-17-5) were added. The flask was placed in an ice/water bath over a stirring plate and stirred. To the flask, 3.7 grams of acetophenone and 5.55 grams of 4-bromobenzaldehyde (Sigma Aldrich, CAS No. 1122-91-4) were added. A stopper was inserted on the top of the flask, and the reaction was left overnight. The product was vacuum-filtered with a Büchner funnel and washed with DI water. The washing was continued until the washings were near a neutral pH.
Recrystallization of Chalcone
A recrystallization was performed with 95% ethanol. The saturated mixture was cooled in an ice/water bath and allowed to crystallize. Using a Büchner funnel, the crystallized product was filtered and left to air dry. The reaction had a percent yield of 65%.
Chalcone Dibromide Preparation
In a 500 mL Erlenmeyer flask, 4.32 grams of chalcone was dissolved in 150 mL of 99.8% acetic acid (Acrōs organics, CAS No.64-19-7). Wearing neoprene gloves, 0.9 mL of bromine (Fisher Scientific, CAS No. 7726-95-6) was combined with 3.9 mL of acetic acid to prepare a 20% solution (v/v). To the flask, a stir bar was added and the flask was placed on a stirring plate. To the solution in the flask, the 4.5 mL of 20% solution was added dropwise. After all the 20% solution had been added, the flask was slowly filled with DI water to precipitate the product. The mixture was vacuum filtered using a Büchner funnel. The product was washed with copious amounts of water to remove any excess acetic acid, and allowed to air dry. This reaction had a percent yield of 76%.
Isoxazole Preparation
To an Erlenmeyer flask, 0.01 mol of the chalcone dibromide was dissolved in 150 mL of 95% ethanol. A solution of 1.4 g hydroxylamine hydrochloride and 3 mL of DI water was added, and the mixture was heated and stirred using a magnetic hot plate. While the mixture was hot, a solution of 3.4 g KOH dissolved in 4 mL of water was added dropwise. The mixture was heated ten minutes after the addition. The mixture was cooled and water was added to crystallize the isoxazole. The crystallization was completed by placing the mixture in an ice/water bath. The crystals were then collected by vacuum filtration and washed with water.
Recrystallization of Isozazole
A recrystallization was performed with 95% ethanol and acetone to fully dissolve. The saturated mixture was cooled in an ice/water bath and allowed to crystallize. Using a Büchner funnel, the crystallized product was filtered and left to air dry. The reaction had a percent yield of 95%
Results
Benzene
The proton NMR shows one singlet at 7.33ppm, indicating that the protons present are homotopic. The chemical shift falls in the aromatic region6 of the spectrum and closely corresponds to the calculated chemical shift of a benzene ring, known to be 7.27 ppm . In the carbon-13 NMR spectrum, one large peak is evident at 128.8 ppm indicating all carbons in the compound are equivalent and is also in the range of aromatic carbon7. The calculated carbon chemical shift of a benzene ring is known to be 128.7 ppm , the same as the observed chemical shift. The IR spectrum showed peaks at frequencies, seen in Table 1, known for the vibrations of aromatic compounds and aromatic stretching . The mass spectrum has a large intensity base peak at m/z 78, which is equal to the molecular weight of benzene. The spectrum was compared to the reference spectrum in the NIST MS Search 2.0 library software and in the NIST database and was identical.
Table 1: IR data for Benzene
Frequency (cm-1) 3100 1550 1100 700
Structure Aromatic Compound C=C stretching In-plane CH deformation Out-of-plane CH deformation
4-bromobenzaldehyde
An aldehyde group is present. The IR spectrum of 4-bromobenzaldehyde, seen the Figure 11 in Appendix 2, shows a carbonyl peak at 1682 cm-1 and a Fermi doublet at 2858 cm-1 and 2756 cm-1, both indicative of an aldehyde. Table 2 shows a proton peak at 10 ppm, which is a known chemical shift of an aldehyde, with an integration of 1. The carbon peak at 191 ppm, seen in Table 2, appears in the DEPT 90 identifying it as a methine. It also falls within the area known for the location of aldehyde groups, further confirming the presence of an aldehyde.
A para-disubstituted benzene ring is present. The carbon peaks at 131 and 132 ppm both appear on the DEPT 90, identifying them as methine groups. Both these carbon peaks and the proton peaks at 7.7 and 7.76 ppm have chemical shifts in the region of an aromatic group. Because there are only methine groups, the proton peaks at 7.7 and 7.76 ppm, both having an integration of 2, are indicative of two identical pairs of methine groups. The doublet splitting pattern means that they are adjacent to each other. Table 2shows that the carbon peaks at 135 and 130 ppm disappear in the DEPT 45 and have chemical shifts in the aromatic region. This indicates two different quaternary carbons in the aromatic group present. Due to the two identical pairs of methine groups being adjacent, the two quaternary carbons complete the aromatic group forming a para-disubstituted benzene.
There is a bromine atom present as one of the substituents. The mass spectrum contains a peak at m/z 184 and another at m/z 186 with an intensity ratio of 100:98. This is the known isotopic signature for a compound containing a bromine atom . From this, the substituents connected to the benzene ring are a bromine atom and an aldehyde group in the paraposition to each other forming 4-bromobenzaldehyde, seen in Figure 2. From these tests, 4-bromobenzaldehyde and benzene were proven to be the compounds provided.
Table 2: Summary of Proton, Carbon-13, and DEPT data for 4-bromobenzaldehyde
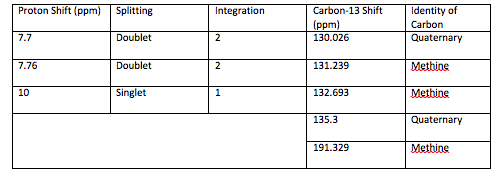

Figure 2: Structure of 4-bromobenzene
Acetophenone
The acylation product is acetophenone. Table 3 shows that the 26.8 ppm carbon peak appears in the DEPT 135 but disappears in the DEPT 90, indicating a methyl group. The HETCOR connects the 26.8 ppm carbon peak to the singlet peak at 2.56 ppm, which integrates to 3. This confirms the presence of a methyl group.
Table 3: Summary of Acetophenone Carbon-13, DEPT, and HETCOR Data
Chemical Shift (ppm) Identity of carbon from DEPT HETCOR showing connected protons (ppm)
26.778 Methyl 2.56
128.509 Methine 7.93 – 7.95
128.790 Methine 7.4 – 7.45
133.323 Methine 7.50 – 7.55
137.3 Quaternary None
198.3 Quaternary None
Table 3 shows that the carbon peaks at 128.5, 128.8, and 133.3ppm all appear in the DEPT 135 and the DEPT 90, indicating methine groups. The HETCOR connects these carbon peaks to the proton peaks between 7.4 ppm and 7.95 ppm. Table 4 shows that the triplet at 7.52 ppm in the proton spectrum had an integration of 1 signifying one methine group, while the triplet at 7.42ppm and the doublet at 7.93 ppm each integrate to 2, indicating each of the peaks are two identical methine groups. The COSY connects the triplet at 7.52 ppm to the triplet at 7.42 ppm. This represents two identical methine groups bonded to a single methine group. It also connects the 7.42 ppm triplet to the doublet at 7.93 ppm. This represents two identical methines connecting to the former two identical methine groups. The doublet splitting pattern of the 7.93 ppm indicates only one adjacent proton, which is present in the adjacent methine group. The carbon peaks at 128.5, 128.8, and 133.3 ppm and the proton peaks at 7.42, 7.52, and 7.93 ppm all have chemical shifts in the aromatic region7. The carbon peak at 137 ppm disappears in the DEPT 45, showing that it is a quaternary carbon. It also has a chemical shift in the aromatic region, meaning that it is part of the aromatic group. The two identical methine groups at 7.93 ppm in the proton spectrum connect to this quaternary carbon completing the aromatic group in the form of a monosubstituted benzene.
The IR spectrum has a high intensity peak at 1679 cm-1 at the range of a conjugated ketone . Table 3 shows a carbon peaks at 198.3 ppm which appears in the carbon-13 spectrum but disappears in the DEPT 45, signifying a quaternary carbon with a chemical shift in the region of a ketone . The ketone is formed in this structure by the connection of the methyl group on one side of the carbonyl group and the aromatic group on the other side. This confirms the product is acetophenone, seen in Figure 3.
Table 4: Summary of Acetophenone Proton and COSY Data
Chemical Shift (ppm) Splitting Integration COSY showing connected protons
2.55 Singlet 3 None
7.40 – 7.45 Triplet of triplets 2 7.50-7.55 and 7.91-7.95
7.50 – 7.55 Triplet of triplets 1 7.40-7.45
7.91 – 7.95 Doublets of triplets 2 7.40-7.45

Figure 3: Structure of 1st Step Product – Acetophenone
4-bromochalcone
A ketone is present in the structure of 4-bromochalcone. The IR shows a peak at 1660 cm-1 which is in the region of a conjugated ketone12. Table 5 shows a carbon peak at 190.5 ppm in the carbon-13 spectrum which disappears in the DEPT, meaning it is a quaternary carbon. Its chemical shift falls in the region of a ketone7. The HETCOR does not connect this carbon peak with any protons further confirming its identity as a ketone.
A methine group is present. The proton NMR shows a peak at 7.7 ppm that has an integration of 1 and a doublet splitting pattern. This means this peak has a single proton split by one adjacent proton. The HETCOR connects this peak to the carbon peak at 143 ppm which appears in the DEPT 90. This confirms the presence of methine group with one adjacent proton. The COSY connects this methine to the overlapping peaks. This means that the one proton that is causing the splitting is within that overlap.
The doublet at 8.1 ppm in the proton spectrum integrates to two. The HETCOR connects this peak to the carbon peak at 128.7 ppm. This peak appears in the DEPT 90, signifying that it is a methine. The peak has an integration of two, which means that there are two homotopic methine groups present. The COSY shows the connection between the 8.1 ppm and the overlapping peaks.
Table 5 shows that the four carbon peaks between 128.9 and 133 ppm all appear in the DEPT 90, meaning they are all methine groups. The HETCOR connects all these to the overlapping proton peaks between 7.49 and 7.63 ppm. From the integration of 8.4 of the overlapping peaks, there are at least eight protons present. Both the overlapping proton peaks and the carbon peaks connecting to them are all in the aromatic region. The number of aromatic protons signifies the presence of two aromatic rings, which was expected from the reaction. The carbon peaks at 125, 134, and 138 are all aromatic carbons which disappear in the DEPT 45. This means they are all quaternary carbons. These will complete the aromatic rings, creating a monosubstituted benzene ring and a disubstituted benzene ring.
After accounting for the protons in the two rings, there is still one proton unaccounted for. This proton is the one proton splitting the methine group at 7.7 ppm explained above. This means that there are two methine groups bonded to each other. In order to be separated from other protons there must be quaternary carbons on either side of these. In order for the methine groups to have their four needed bonds, a double bond must be formed between the methines.
The mass spectrum shows the molecular ion peak at m/z 286 and a peak at m/z 288 which is the isotopic signature of a bromine atom11. The loss of the bromine atom produces a peak at m/z 207 as seen in Table 7. From the fragments, the ketone is connected on the side of the monosubstituted benzene ring, while the double bonded methines are connected to a disubstituted benzene ring. Had the fragments been connected the other way, the peaks at m/z 103 and 104 would be the large peaks, not m/z 102 and 105. The ketone connects to the double bonded methine groups to form 4-bromochalcone.
Table 5: Summary of Carbon-13, DEPT, and HETCOR data for 4-bromochalcone
Chemical Shift (ppm) Identity of carbon from the DEPT HETCOR showing connected protons (ppm)
122.824 Methine 7.49 – 7.55
125.3 Quaternary None
128.773 Methine 8.1
128.960 Methine 7.49
130.065 Methine 7.49
132.491 Methine 7.55
133.230 Methine 7.60
134.2 Quaternary None
138.231 Quaternary None
143.652 Methine 7.75
190.5 Quaternary None
Table 6: Summary of Proton NMR and COSY data for 4-bromochalcone
Chemical Shift (ppm) Splitting Integration COSY showing connected protons (ppm)
7.49 – 7.63 Overlapping 8.42 7.68 – 7.78 and 8.1
7.75 Doublet 1 Around 7.57
8.05 Doublet 2 Around 7.57
Table 7: Fragments from mass spectrum (dotted lines are the location of the fragmentation)
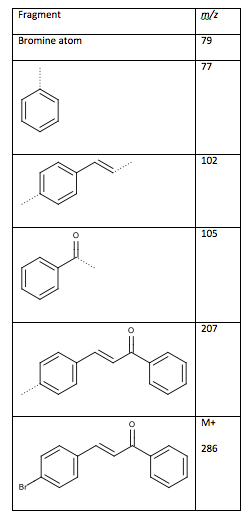

Figure 4: Desired Structure of 4-bromochalcone
Dibrominated Chalcone – 2,3-dibromo-3-(4-bromophenyl)-1-phenylpropan-1-one
A ketone is present. The IR spectrum of the dibrominated chalcone has an intense peak at 1678 cm-1 at the range of a conjugated ketone. Table 8 shows a carbon peak at 192ppm in the carbon-13 spectrum which disappears in the DEPT 45. This indicates that it is a quaternary carbon and its chemical shift indicates the presence of a ketone. The peak at 192 ppm does not connect to any protons on the HETCOR, further indicating a ketone.
The carbon peaks at 46 and 48 ppm both appear in the DEPT 45 and also the DEPT 90, meaning they are methine groups. The HETCOR connects these two carbon peaks with the two doublets in the proton spectrum at 5.60 and 5.78 ppm. Table 9 shows that the proton peaks both have integrations of 1, meaning they are each a single methine group. The COSY connects these two peaks only with one another, which means two methine groups are bonded together with no adjacent protons. The chemical shifts of these peaks fall into the region of carbon bromine atom, indicating each have a bromine atom attached to them.
Table 8 shows the carbon peaks between 129.2 and 134 ppm all appear in both the DEPT 45 and the DEPT 90, which means they are all methine groups. From the HETCOR, the peaks at 129.3 and 132 ppm are connected to the triplet at 7.57 ppm on the proton NMR. This proton peak integrates to 4, meaning there are four methine groups present. The COSY shows that the peak at 7.57 ppm splits the 7.69 ppm and the 8.1 ppm peaks. The triplet at 7.69 ppm integrates to 1 indicating one methine split by two methine groups, while the doublet at 8.1 ppm integrates to 2. This signifies two identical methine groups are each split by one of the two 7.57 ppm methine groups. These peaks are all located in the chemical shift region of aromatic functional groups . From this, a monosubstituted benzene ring is present. Calculating the chemical shift for a monosubstituted benzene ring with a ketone substituent , the chemical shift of a proton with a ketone in the ortho position resulted in 7.91 ppm. The calculated carbon chemical shift of the conjugated ketone as a substituent to ring is the same as the actual carbon chemical shift. This confirms that the conjugated ketone is the substituent to the ring. The quaternary carbon needed to make this connection has a calculated chemical shift of 136.6 ppm , which can be seen in Table 8 at 138ppm.
The COSY shows that the doublet at 7.40 ppm is also splitting the peak at 7.57 ppm, which still has two protons unaccounted for due to its integration. The doublet at 7.40 ppm has an integration of 2, which signifies two methine groups each split by a methine group at 7.57 ppm. Because only the doublet is splitting the 7.57 ppm peak, this is a para-disubstituted benzene ring due to the peaks falling into the chemical shift region of an aromatic group. The mass spectrum of the compound has a signature isotopic peak of a bromine atom with a ratio of 100:99 at m/z 285 and 28711. Calculating the carbon chemical shift of a proton with an ortho-positioned bromine atom and quaternary carbon with a bromine attached, the resulting chemical shifts were 132.0 ppm and 123.3 ppm. The HETCOR connects the proton peak at 7.57 ppm to the carbon peak at 132.4 ppm, which closely compares to the calculated shift. An aromatic carbon peak at 124 ppm also appears in the carbon-13 NMR and disappears in the DEPT 45, meaning it is a quaternary carbon. These two carbons are in the para position from each other.
The mass spectrum does not show the molecular ion due to the fact that the bromide atoms readily fragment off. The fragments, shown inTable 10: Mass spectrum fragments of the chalcone dibromide (dotted lines indicate where cleavage has occurred), show the major fragmentations from the mass spectrum. From the fragment at m/z 102, the connection between the two methine chain and the disubstituted benzene ring is confirmed. This confirms the structure as 2,3-dibromo-3-(4-bromophenyl)-1-phenylpropan-1-one, as seen in Figure 5.
Table 8: Summary of Carbon-13, DEPT, and HETCOR data for 2,3-dibromo-3-(4-bromophenyl)-1-phenylpropan-1-one
Chemical Shift (ppm) Identity of carbon from the DEPT HETCOR showing connected protons (ppm)
46.774 Methine 5.78
48.960 Methine 5.60
124 Quaternary None
129.186 Methine 8.10
129.326 Methine 7.57
130.251 Methine 7.40
132.375 Methine 7.57
134.583 Methine 7.69
138 Quaternary None
192 Quaternary None
Table 9: Summary of Proton NMR and COSY data for 2,3-dibromo-3-(4-bromophenyl)-1-phenylpropan-1-one
Chemical Shift (ppm) Splitting Integration COSY showing connected protons
5.60 Doublet 0.97 5.78
5.78 Doublet 1.00 5.60
7.40 Doublet 2.13 7.57
7.57 Triplet 4.11 7.40, 7.69, and 8.10
7.69 Triplet 1.06 7.57
8.10 Doublet 2 .00 7.57
Table 10: Mass spectrum fragments of the chalcone dibromide (dotted lines indicate where cleavage has occurred)
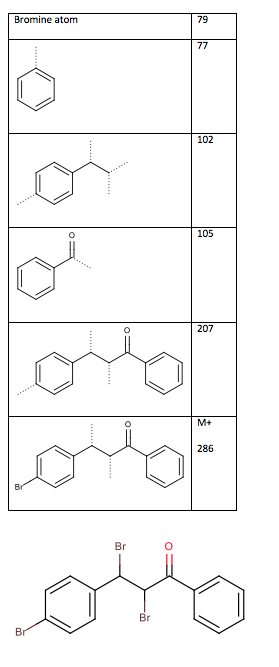
Figure 5: Structure of 2,3-dibromo-3-(4-bromophenyl)-1-phenylpropan-1-one
Final Product – 3-(4-bromophenyl)-5-phenylisoxazole
An isoxazole ring is present. The IR spectrum, in Figure 31 of Appendix #5, shows a peak at 1370 cm-1 and at 764 cm-1 which are known characteristic peaks of an isoxazole ring . Using Marvin Sketch, the chemical shifts of the carbons creating the isoxazole ring were calculated. The carbon bonded to the oxygen was calculated to be 156 ppm, while the carbon bonded to the nitrogen was calculated to be 154 ppm. The connecting methine, which completed the ring, was calculated to have a chemical shift of 99 ppm. Table 11 shows that the carbon peaks at 163 and 169 ppm both disappear in the DEPT 45, meaning they are quaternary. They are also close to the calculated chemical shifts. The carbon peak in the spectrum at 99 ppm appears in the DEPT 90, meaning it is a methine. Its identity and its chemical shift are exactly the same as the calculated chemical shift. This confirms the presence of the isoxazole ring.
From Table 11, all carbon peaks not yet accounted for are methines in the aromatic region and are connected by the HETCOR to aromatic proton peaks. This means that the aromatic rings from the reagents are still intact. Table 11 shows that each of the methine carbon peaks connect to one proton peak, except the proton peak at 7.53 ppm which has two carbon peaks connected to it. The 7.53 ppm proton peak has an integration of 3, meaning there are three protons present. The COSY connects this peak to the proton peak at 7.9 ppm, which has an integration of 2. This is the monosubstituted benzene ring. Calculating the chemical shift of the protons in the monosubstituted benzene ring, the three protons furthest from the substituted carbon have the same chemical shift, which is why the two carbon peaks connect to the same proton peak.
A disubstituted benzene ring is formed by the carbon peaks at 127.5 and 132 ppm. The HETCOR connects the 127.5 ppm peak to the proton peak at 7.7 ppm and the 132 ppm peak to the proton peak at 7.6 ppm. Both are doublets and integrate to two. This means that each peak signifies two homotopic methine groups that are each split by only one proton. The COSY connects these two proton peaks, forming the sides of the disubstituted benzene ring. The final two quaternary carbons at 124 and 126 ppm complete the ring.
The mass spectrum, in Figure 39 of Appendix #5, shows the molecular ion peak at m/z 299, further indicating the presence of the nitrogen by the odd value of the molecular ion. The isotopic signature of a bromine atom can be seen by the approximately equal intensities of the molecular ion and the peak at m/z 301.
Isoxazoles are known to fragment at the nitrogen-oxygen bond and the double bonded carbons near the oxygen . From this, the mass spectrum can determine which of the two possible structures, shown in Table 13, is the correct structure. From the possible fragments shown in Table 13, the base ion in the mass spectrum is at m/z 183, meaning there is a high concentration of a fragment at that peak. From this the structure in Figure 6 is the confirmed structure of the final product.
Table 11: Summary of Carbon-13, DEPT and HETCOR data for 3-(4-bromophenyl)-5-phenylisoxazole
Chemical Shift (ppm) Identity of carbon from the DEPT HETCOR showing connected protons (ppm)
98.153 Methine 6.88
124.7 Quaternary None
126.6 Quaternary None
127.078 Methine 7.9
127.545 Methine 7.75
129.248 Methine 7.53
130.422 Methine 7.53
132.589 Methine 7.67
163.4 Quaternary None
169.6 Quaternary None
Table 12: Summary of Proton and COSY data for 3-(4-bromophenyl)-5-phenylisoxazole
Proton Chemical Shift (ppm) Splitting Integration COSY showing connected protons
6.88 Singlet 1 None
7.53 Overlapping 3 7.9
7.67 Doublet 2 7.75
7.75 Doublet 2 7.67
7.9 Overlapping 2 7.53
Table 13: Two possible structures and mass spectrum fragments (the dotted lines indicate where the compound was cleaved)
Structure/Fragment m/z

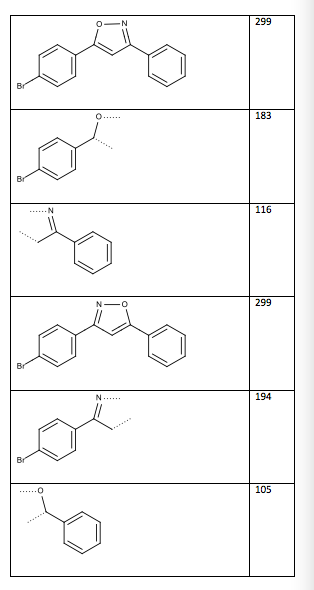
Figure 6: Structure of 3-(4-bromophenyl)-5-phenylisoxazole
Appendix #1
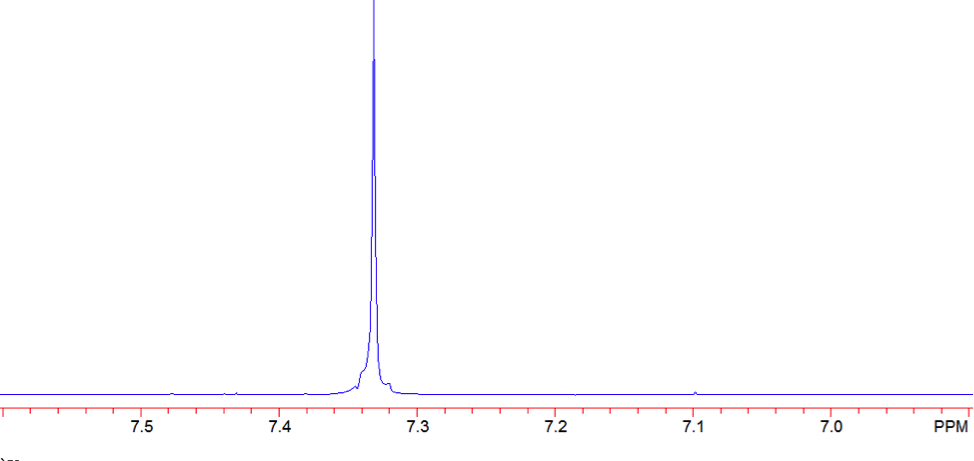
Figure 7: Proton NMR of Benzene
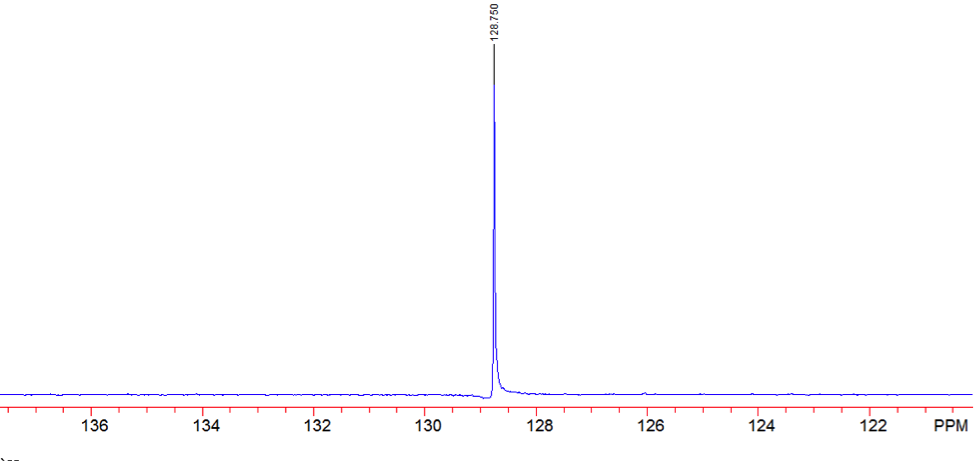
Figure 8: Carbon- 13 NMR of Benzene
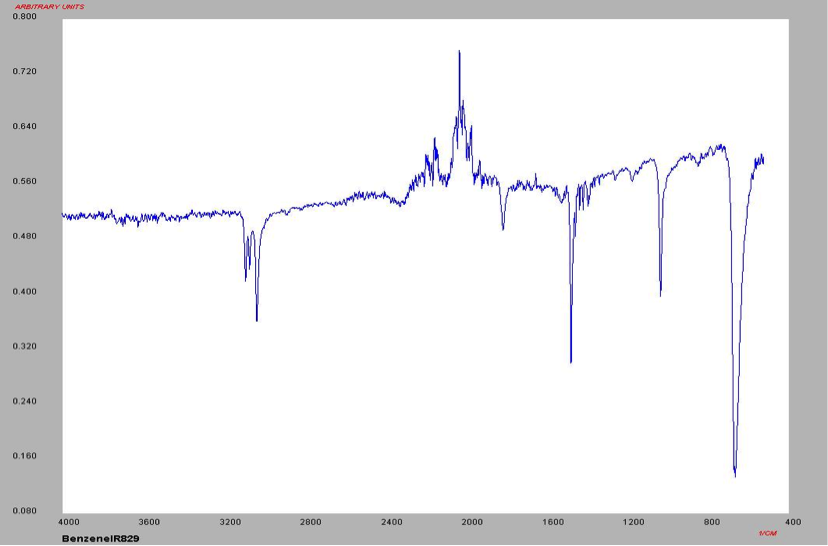
Figure 9: IR Spectrum of Benzene
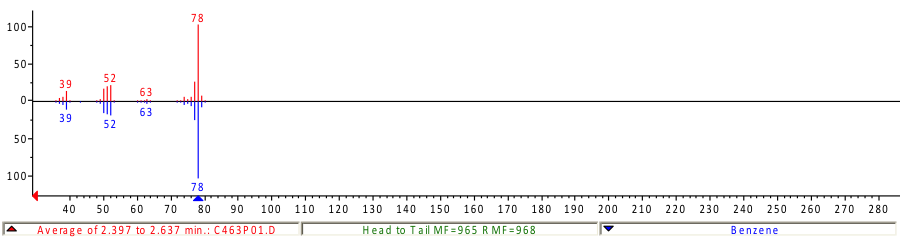
Figure 10: Mass Spectrum of Benzene
Appendix #2
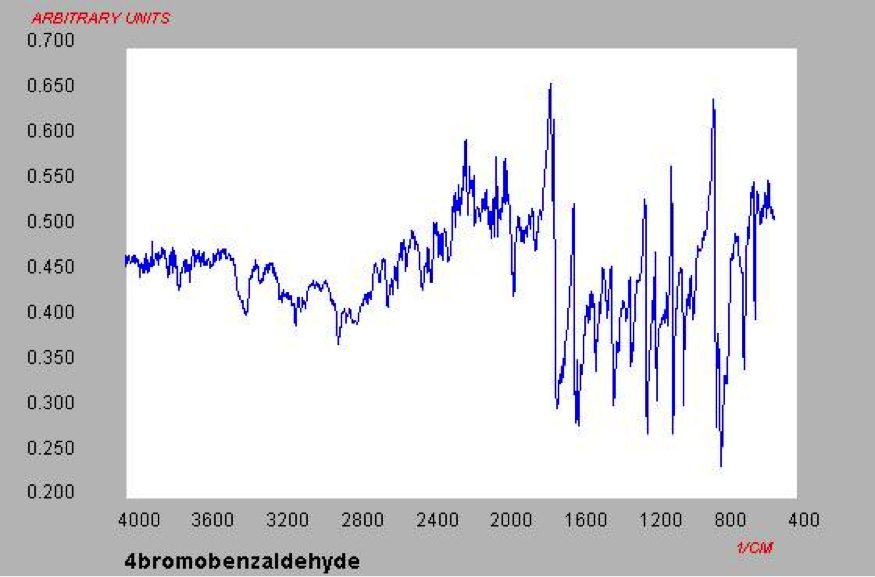
Figure 11: IR Spectrum of 4-bromobenzaldehyde
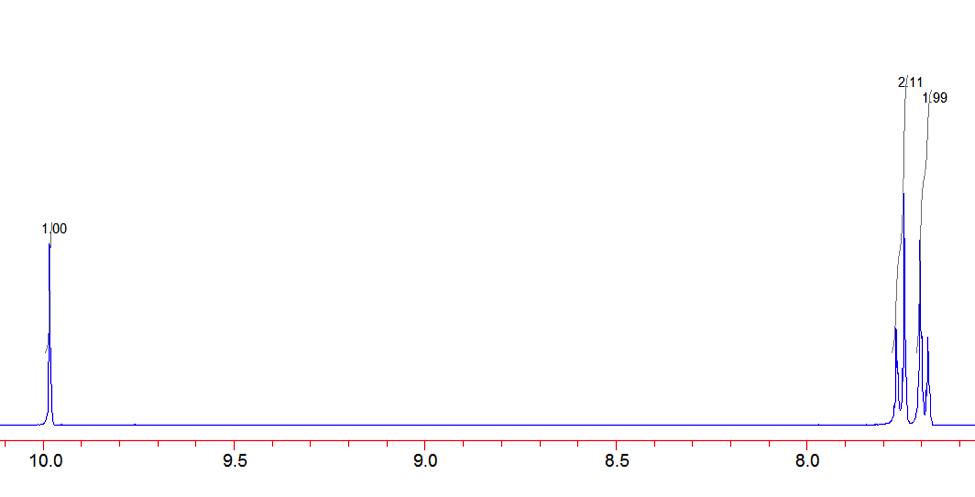
Figure 12: Proton NMR of 4-Bromobenzaldehyde
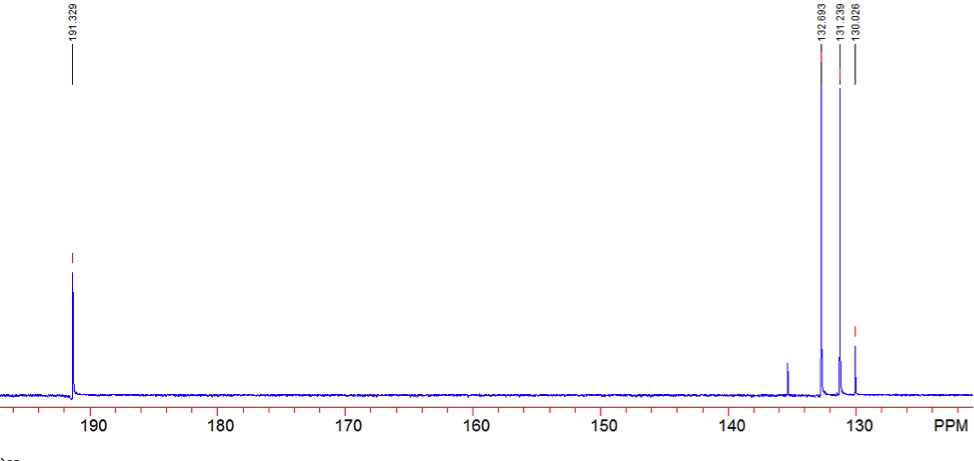
Figure 13: Carbon-13 NMR of 4-bromobenzaldehyde
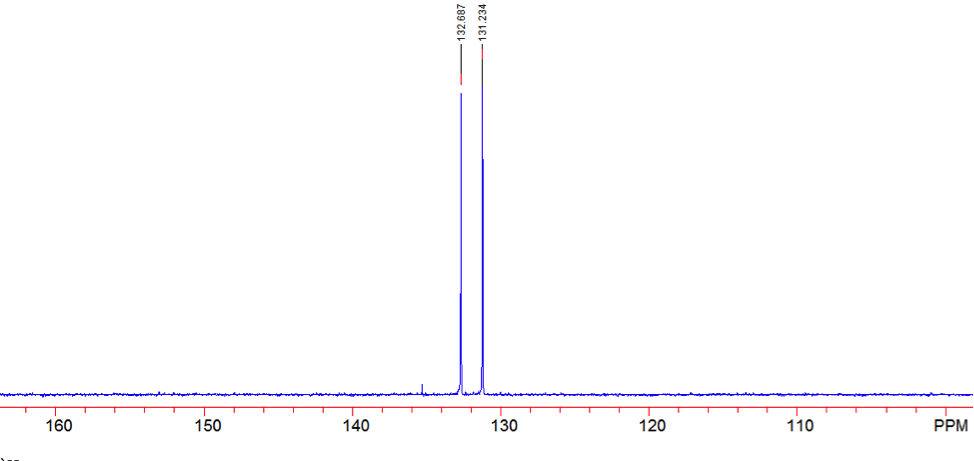
Figure 14: DEPT 45 of 4-bromobenzaldehyde
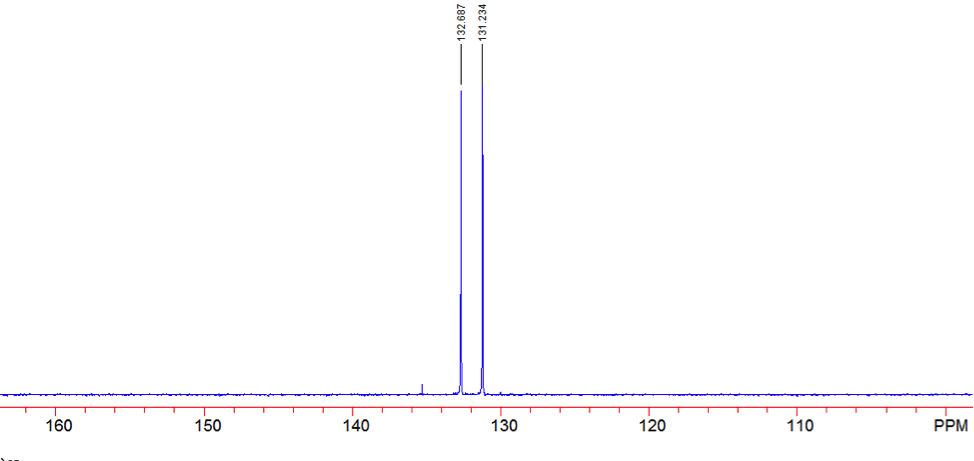
Figure 15: DEPT 90 of 4-bromobenzaldehyde
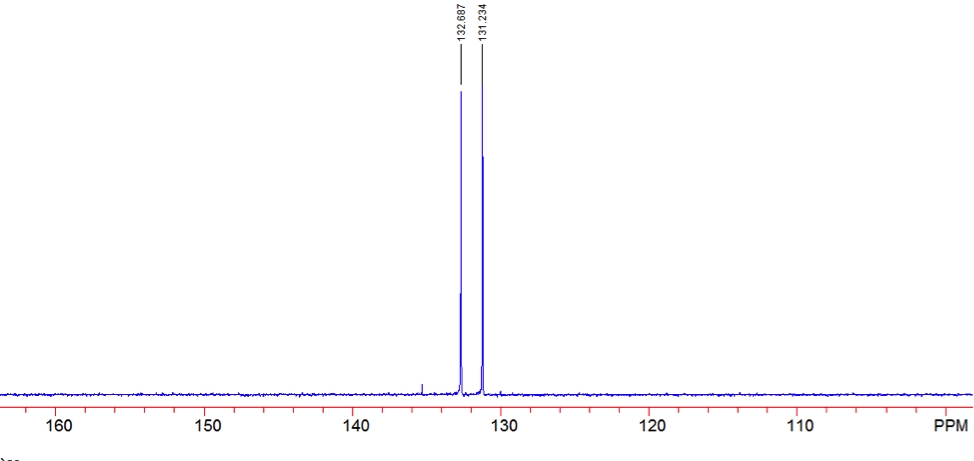
Figure 16: DEPT 135 of 4-bromobenaldehyde
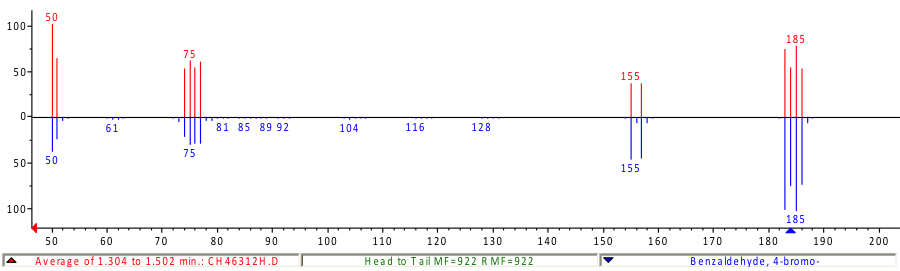
Figure 17: Mass Spectrum of 4-bromobenzaldehyde
