ACID-BASE Equilibria Experiments
By: Ludmila Novikova
Section A: Conductimetry and the Strength of Acids and Bases:
Goal: To understand how conductivity experiments work and to be able to identify strong and weak acids and bases via the use of equilibrium constants.
Summary: In this section of the lab, Dr. Thompson carried out several experiments to show how certain substances allow the conductivity of electricity to occur.
1.) The first experiment was one between sugars in water. There was a light bulb with a metal wire that was placed into the sugary solution. The mixture did not allow the light bulb to light up. From this, we can say that sucrose is a non-electrolyte and does not conduct electricity.
2.) The second experiment was the mixture between salt in water. When the light bulb wire was placed into the solution, there was light because salt is an electrolyte solution.
3.) The third experiment involved a mixture of pure vinegar. Vinegar allowed the light bulb to make light but it was not very bright. The light was not very bright because vinegar has an acid called acetic acid (CH3COOH). Acetic acids are weak acids.
4.) The fourth experiment was where the light bulb wire was placed into a solution of HCl. HCl created very bright light because it is a strong acid. The bright light was apparent because HCl dissociated completely, just like all strong acids do.
5.) The fifth experiment had to do with sodium hydroxide (NaOH). The NaOH allowed bright light to happen because the NaOH dissociated completely. NaOH is a strong base and strong bases are good conductors of electricity, they also dissociate completely.
6.) The sixth experiment was the one with ammonia (NH3). Ammonia is a conductor of electricity but it created weak light. Weak light was present because ammonia is a weak base. In this experiment, the ammonia accepted a proton from water.
7.) The seventh experiment was the mixture of vinegar and ammonia. Although both create weak light when are separated, they created bright light when they were mixed because the chemical reaction became neutralized.
Generalizations/Conclusion: From the listed experiments, a solution can conduct electricity when the concentration of ions within the solution is high. Also, good conductors of electricity completely dissociate in water. Some chemicals that do not completely dissociate in water allow electricity to be conducted, but because they don’t completely dissociate, they are not the best conductors of electricity. Conductive substances must allow covalent bonding and the electrons must be free to move. If the equilibrium constants, which express wither the acid or base, are small (X≤102), they do not dissociate completely and this means that the chemical solutions are either weak bases or weak acids. However, if the equilibrium constants (Ka or Kb) are large (X≥102), this means that the solutions will dissociate completely and they might even be strong acids and strong acids, depending on the solution being used.
Section B: Acid-Base Equilibria and Indicator Dyes
Goal: Observing acid-base equilibria with the use of bromocresol green indicator dye.
Summary: Bromocresol green is an organic compound that indicates a color change when it’s placed into solutions that are either acidic or basic. The protonated, acid form of the dye is symbolized as HIn. The unprotonated, base form of the dye is symbolized as In–. The dissociation of the this indicator is as follows: HIn ↔ H+ + In–
In the procedure, we had to place 1 drop of the .03% bromocresol green indicator solution into the six wells of the 1×12 well strip. 1 drop of .01M HCl was placed into the first well and then 1 drop of .01M NaOH was placed into the 3rd well. 3 drops of pH 4 solution were placed into those first three wells. The color changes are indicated by the pictures below.
From the picture above, the Ka value for methyl orange came out to be 10-4M. The value was the same for bromocresol green. The Ka value was 10-6M for bromothymol blue, and 10-10M for phenolphthalein. These values were found by finding the well in each row where there was an extreme color change.
Conclusion: The weakest acid indicator came out to be bromothymol blue.
Section D: pH Measurement with Indicator Color Probes
Goal: To use the Universal Indicator (UI) as a color probe for sensing the concentration of H+ to the find the pH of various solutions.
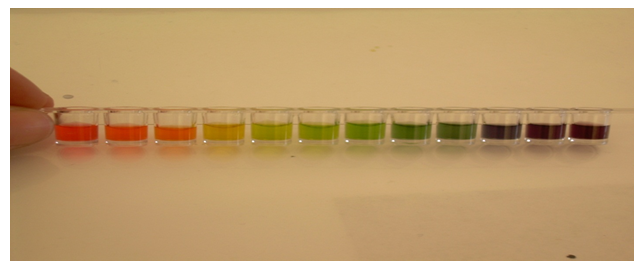
Summary: The UI is used to observe the color change from pH of 1 to 12. To be able to make this observation, a colorimetric pH meter was created for measuring the pH of various sample solutions. To create the pH meter, 1 drop of the UI was delivered to each well of the 1×12 well-strip. Then, 3 drops of each different pH solution (1-12) were delivered to the wells separately (not mixed together). The picture of the calorimetric pH meter is shown below.
When the pH meter was made, various solutions were tested to have their pH measured. I tested HCl, NaOH, CH3COOH, H2SO4, and NH3. The pH for those solutions came out to be 1, 11, 3, 1, and 10. The picture below shows a comparison between these five various solutions and the pH meter.
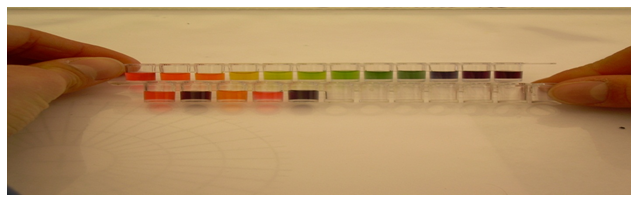
Conclusion: By Using the calorimetric pH meter, we can identify the pH of strong and weak acids and bases.
Section E: The Study of Acid-Base Equilibria by Graphical Interpretation of Titration Data
Goal: To observe quantitative aspects of acid-base chemistry by interpreting titration curves and by comparing the data with computer-simulated titrations.
Summary: Titration curves show the analysis of reaction stoichiometry. They also provide information about the molar mass of the acids and bases and their equilibrium constants. Acid-base titrations usually involve the addition of a solution of an acid or a base to the solution that is its opposite, so that the neutralization reaction can be monitored to analyze the reaction process. To find pH values, we can use the colorimetric pH meter.
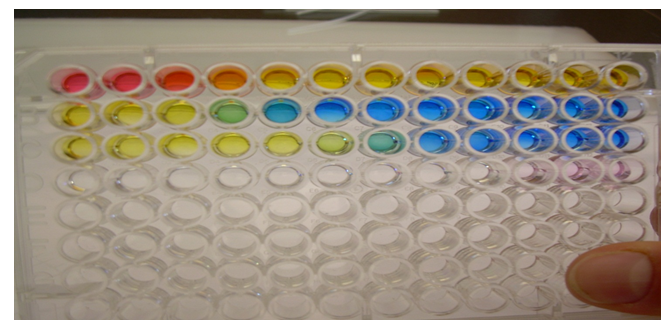
Part1: Titration of a Strong Acid with a Strong Base: A serial titration was carried out with NaOH to see the reaction process between .05M HCl and .01M NaOH. The pH meter strip was used to measure the pH values. They came out to be: 2,2,2,3,3,11,11,11,12,12. Each value corresponds to the well number in the 94 well-tray of row A.
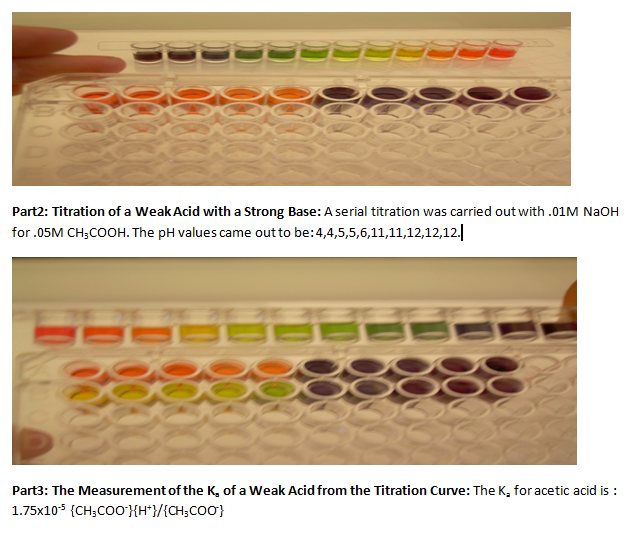
Part4: The Henderson-Hassel Balch Equation: This equation links the pH of solutions in titrations of weak acids with the pKa in the Henderson-Hassel Balch equation. All it states is that the pH=pKa + log10{A–}/{HA}
Part5: Titration Curves and Buffer Solutions: Buffer solutions are solutions of weak acids or weak bases that resist change in pH when small amounts of strong acid or base solution are added. The titration curve where “buffering” occurs is called the buffer region.
Part6: The Dilution of Buffers: We had to look at 5 titration curves for different amounts of CH3COOH with NaOH. We then had to find the pH values of the 5 solutions. Overall, the buffer solutions can be diluted but at the same time they will keep their pH values. But, if the dilution is too extreme, the pH values do change significantly.
Part7: The Selection of Weak Acids to Make Buffer Solutions of Desired pH: The buffering action can only occur because there is a high concentration of water, and if the buffers are made from strong acids or bases, then they are called pseudo buffers.
Part8: The titration of Weal Bases with Strong Acids: In part 8 of this section, 1 drop UI was delivered to each well of row C of the 96-well tray. A serial titration was carried out with the weak base of .05M NH3 and with the strong acid .01M HCl. The pH values came out to be: 10, 5, 2, 2, 2, 3, 3, 3, 3, and 3.
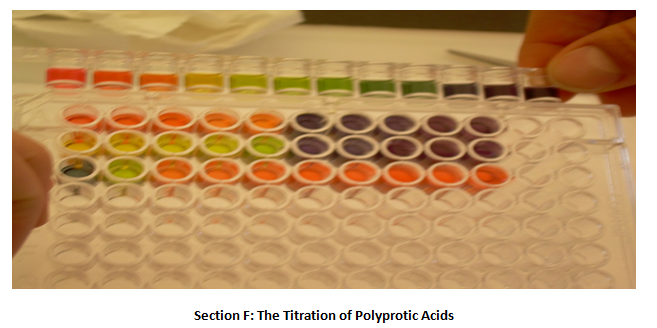
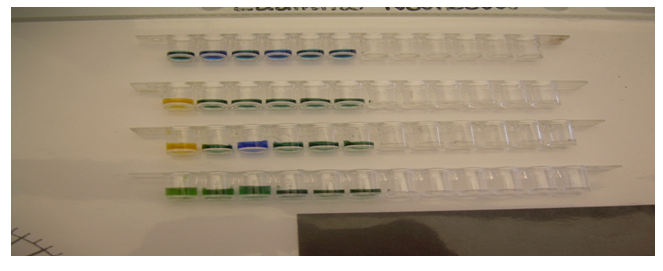
Goal: Apply graphical interpretations of titration data to investigate Polyprotic acid equilibria.
Summary: One drop of UI was delivered to each well of row D of the 96-well tray. Then, 1 drop of .04M H3PO4 was delivered to each well in row D as well. A serial titration was carried out with .01M NaOH. The pH values came out to be: 2,2,3,3,5,6,7,7,11,and 12.

Conclusion: Overall, H3PO4 is a triprotic acid and it has 2 equivalence points because it is a borderline weak/strong acid. In the last experiment, NaOH was the limiting reagent.
