Cis- Trans Equilibrium of N-Acetyl-L-Proline
Purpose:
Using H-NMR, in this experiment we sought to study the effect of pH and polarity of the solvent on the Ktrans values of N-Acetyl-L-Proline. The Ktrans values are a means to examine the equilibrium between cis and trans isomers of N-Acetyl-L-Proline. The area under the peak of the H NMR was integrated and divided accordingly to give the Ktransvalues. Ktrans values were used in the calculation of the proportion of cis isomers in the sample.
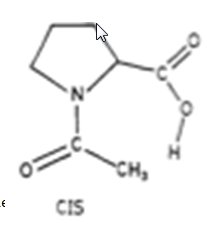
The picture below depicts the two conformations of N-acetyl-L-Proline.
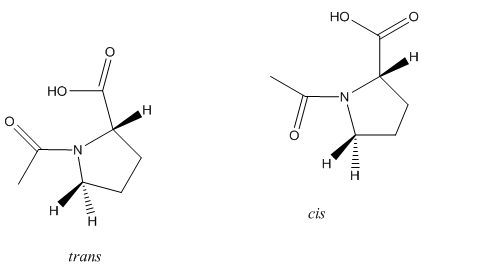
Figure 1: The picture above depicts the two conformations of N-acetyl-L-Proline.
Experimental:
The experiment was conducted following the procedure outlined in Experiments for Biophysical Chemistry Laboratory by Benjamin J. Killian. A Varian NMR with iNOVA software at a frequency of 500 MHz kept at 4 in liquid Helium and Nitrogen was used. 5mg of solid N-acetyl-L-proline was dissolved in 0.7 ml of 45/55 mixture of -benzene/CDCl3, at pH 2 and 7, and -acetone. A small amount of TMS was added as internal standard. The H-NMR spectra were obtained at 25 .
Error Analysis
Data and Results
Table 1 shows the data from each spectrum. This data was used to determine the Ktrans of N-Acetyl-L-Proline by using the values of the areas under the peaks found by integration.
Integration, Chemical Shift and Multiplicity of the four protons in N-Acetyl-L-Proline.
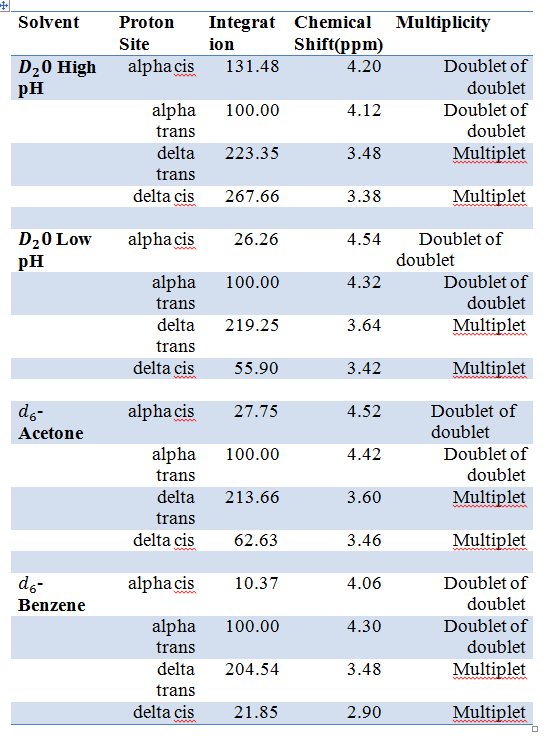
The protons were taken as a reference and their integration was set to 100. The peaks that are twice the size of the reference are the since the position has two hydrogen, thus giving and integration of about 200. The cis hydrogen also have a similar chemical shift as the trans hydrogen and they located next to each other.
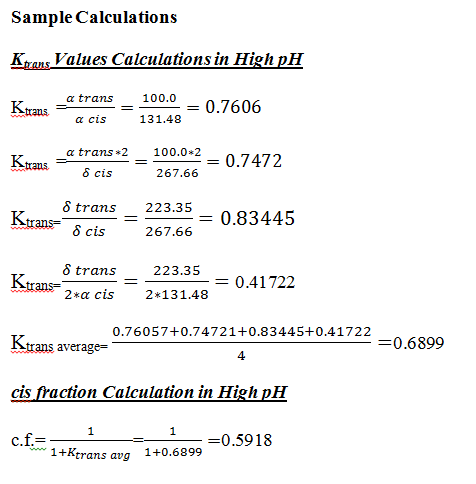
Once the integration of all the species were determined, the Ktrans of the sample was determined by comparing the values of each peak against the others using the following equations:
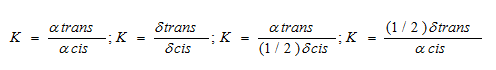
This method allowed for the calculation of Ktrans by comparison of all four values. The values for Ktrans are listed in Table 2.
Table 2 shows the different calculations done to obtain the Ktrans values under the four tested conditions.
Ktrans values calculation and error analysis values.
| Solvent | Ktrans
Ave |
Std Dev. | λ95 | ||||
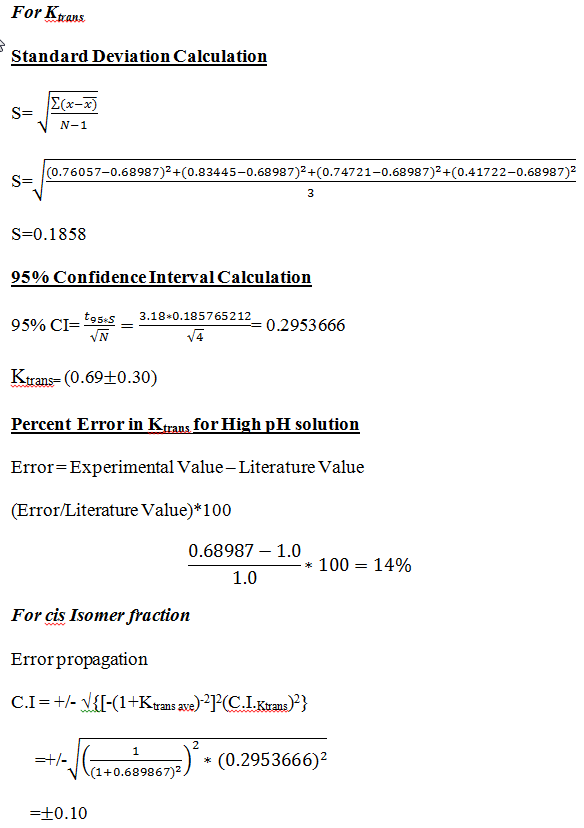
| High pH | 0.76057 | 0.8345 | 0.7472 | 0.41722 | 0.6899 | 0.1858 | 0.30 |
| Low pH | 3.808 | 3.922 | 3.578 | 1.961 | 3.317 | 0.9154 | 1.5 |
| Acetone | 3.604 | 3.412 | 3.193 | 1.706 | 2.979 | 0.8649 | 1.4 |
| Benzene/ | 9.643 | 9.361 | 9.153 | 4.681 | 8.210 | 2.361 | 4 |
The Ktrans values were determined with 95% confidence interval. The Ktrans values were used to determine the fraction of the cis isomer for each system.
Table 3 shows the calculations that were done to calculate the cis isomer fraction of N-acetyl-L-Proline under the four tested conditions.
Cis isomer fraction in each of the tested solvent and error analysis
| Solvent | Ktrans | Fraction of Cis isomer | λ95 |
| High pH | 0.6899 | 0.5918 (56.18%)
|
0.59 |
| Low pH | 3.317 | 0.2316 (23.16%)
|
0.2 |
| -Acetone | 2.979 | 0.2514 (25.14%) | 0.3 |
| -Benzene | 8.210 | 0.1086 (10.86%) | 0.1 |
The cis isomer fraction and its 95% confidence interval was determined for each system and all the values were put together in a summary table where they were compared with the literature values.
Table 4 summarizes the important values from the experiment and compares them with values from the literature. The Ktrans values were compared to values reported by Hunston in the Journal of the American Chemical Society in 1985 in the issue number 107, 2654-2661 and Hunston, R.N.; Gerothanassis, I.P.; Lauterwein, J. in J. Am. Chem. Soc . issue 1985, 107, 2654-2661 among other sources.
Summary Table with literature values
| Solvent | Ktrans avg | Ktrans from literature | St. Deviation | λ95 | Fraction of Cis Isomer | Fraction of Cis Isomer from literature | λ95 |
| High pH | 0.6899 | 0.18577 | 0.30 | 0.5918
(56.18%)
|
51.8% | 0.59 | |
| Low pH | 3.317 | 3.0-4.4 | 0.91541 | 1.5 | 0.2316 (23.16%)
|
25.0% | 0.2 |
| -Acetone | 2.979 | 3.8 | 0.86493 | 1.4 | 0.2514 (25.14%) | 21.0%-21.4% | 0.3 |
| -Benzene | 8.210 | 9.0 | 2.3612 | 4 | 0.1086 (10.86%) | 4.3%-9.5% | 0.1 |
Discussion
The theory behind this experiment is that pH and polarity of the solvent used can both affect the equilibrium between the cis and trans isomer of a N- Acetyl-L-Proline solution.
Generally, the trans isomer is favored because it presents less steric strains and allows for intra molecular hydrogen bonding between the carboxyl group and the oxygen on the amide group of the molecule. This gives the molecule a more non-polar state because the polarity is partially dispersed through the hydrogen bond. This partially non-polar state is achieved in the trans conformation and explains why the trans conformation is favored in non-polar solvents. When a nonpolar solvent such as benzene is used, the trans isomer is expected to be more prevalent. In non-aqueous systems, the equilibrium constant increases as the solvent polarity decrease .The picture below illustrates the above two paragraphs.
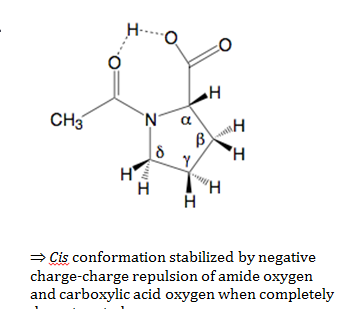
Furthermore, another trend is seen when examining the conformations of N-acetyl-L-Proline in different pH levels. In a solution of high pH, the basic solution disrupts hydrogen bonding, thus lessening the concentration of the trans isomer because the carboxyl hydrogen is removed by bases in the solvent, leaving two negatively charged oxygen in close proximity to one another. This electrostatic repulsion tends to push the molecule into the cis conformation in order to avoid this electrostatic hindrance. However, at low pH, the trans isomer is expected to predominate because there are excess protons in the solution so the carboxyl hydrogen is not liberated and no electrostatic repulsion is produced between the neighboring oxygen.
The literature value for Ktrans of the acidic D2O sample was 3.0 – 4.4,1,2,3,4. The literature value for the basic D2O sample was 0.8 – 1.02,3,4. The values calculated in the literature were done at 30°C and not 25°C. The D6-acetone sample gave a Ktrans of 3.82,4 at 40°C. The 45/55 d6-benzene/CDCL3 sample was determined to have a literature value of 9.03,4 at 30°C.
The results obtained from the experiment gave values that are close to those reported in the literature. The average value for Ktrans in basic was 0.30, which falls with the range reported for Ktrans under basic condition with a percent error of 1.5%. The average value of Ktrans of N-Acetyl-L-Proline in acidic obtained was 1.5, which again falls within the range expected with a percent error of 10%. The average value of Ktrans of N-Acetyl-L-Proline in acetone was 1.4. This value is a little off from the value reported in the literature with a percent error of 22%. The value of the average for Ktrans of N-Acetyl-L-Proline in benzene is 4 with a percent error of 8.8%.
The numbers obtained corroborate the theory behind the experiment. Because at high pH (Ktrans =0.30) the intra molecular forces within N-Acetyl-L-Proline are disprupted, the cis isomer is thus the dominant for of the compound which explains why the Ktrans is less than 1( the denominator is less than the numerator). At low pH, the intra molecular forces are prevalent and the trans isomer predominates, which explains why we obtained a Ktrans greater than 1 (Ktrans =1.5). When benzene was used as solvent, we observed a huge increase in Ktrans. This phenomenon is explained by the high non-polarity of benzene, which allows for a greater number of hydrogen bonds to form within N-Acetyl-L-Proline. When acetone was used, the Ktrans value was relative high but not as high that of benzene since acetone is less polar than benzene.
On the other hand the trend observed in the cis fraction values also corroborate the hypothesis. The fraction of cis isomer is very high (56.18%)in the basic solution because intra molecular forces are disrupted, thus lessening the fraction of trans isomer. For low pH (23.16%) and acetone (25.14%), the percent of the cis fraction is roughly similar. We expect such a result because these conditions allow for enough intra molecular bonding, thus leading to a large portion of trans isomer. For benzene, only 10.86% of cis isomer was found. This makes sense since as a non-polar solvent like benzene allows formation of a greater number of hydrogen bond.
A study using 17O NMR showed that N-Acetyl-L-Proline was found to have 25.0% 2 of the molecules in the cis conformation in conditions under pH 2, compared to 23.16% from the experiment with a percent error of 7.36%. 51.8%2 of the compound was in the cis conformation in conditions above pH 9 compared to 56.176% in the experiment with a percent error of 8.84%. 4.3%-9.5% of the molecules had the cis conformation in benzene compared to 10.86% from the experiment with a percent error of roughly 14.3%. 21.0%-21.4% of the molecules had the cis conformation in acetone compared to 25.14% in the experiment with a percent error of 17.5%.
In conclusion, both electrostatic and steric hindrance effects play a role in determining the conformation of N-acetyl-L-Proline. By comparing solvents, polar/nonpolar and basic/acidic, one can determine what conformation is most stable under each condition. This experimental evidence can be used to supplement the intramolecular hydrogen bond and repulsive oxygen theories presented earlier. Further, the experimental results, which largely agree with those from the literature, prove how powerful and invaluable a tool H-NMR spectroscopy is to the scientific world.
Acknowledgements and Works Cited
I would like to thank David in the NMR room for operating the NMR and explaining its theory and application.
- Bedford, G.R.; Sadler, P.J. Biochem. Biophys. Acta 1974, 343, 656-662
- Hunston, R.N.; Gerothanassis, I.P.; Lauterwein, J. J. Am. Chem. Soc. 1985, 107, 2654-2661
- Madison, V.; Schellman, J. Bioploymers 1970, 9, 511-567
- Williams, K.R.; Adhyaru, B.; German, I.; Alvarez, E. J. Chem. Edu. 2002, 79, 372-373
