Determination of Copper and Lead in Brass
Determination of Cu and Pb in Brass
By: T.A. Alicia Smith
Introduction
In this experiment, four different methods were used in determining the concentration of copper and lead presence in the unknown brass sample #10. Methods of High-performance liquid chromatography (HPLC) and atomic absorbance spectroscopy were used to measure both copper and lead concentration in the unknown brass while the Gravimetric analysis was used solely to determine the lead concentration. The anodic stripping voltammetric method was also used to determine the copper presence in the unknown brass sample. Brass is an alloy consisting primarily of copper and zinc. Brass is popular because it has gold-like color with higher malleability than gold, silver, or bronze, making it a favorable choice for decorations or house ornaments. Brass is also used in instruments for its apt acoustic properties. One of the most important and practical use of brass is in plumbing pipes which brings up a serious demand for strict regulation of the brass content. Lead is often added to enhance the machine ability of brass. Although only a small trace of lead is added to brass, it needs to be monitored and all together prevented when applicable because of the detrimental effects of lead on people. The lead concentration in water going through brass pipes could ultimately kill people as history has taught us about the Romans and their lead aqueducts. For such reason different methods were used to find the brass components for comparison and analysis in the end to determine the most accurate and precise method based on their results.
Experimental Methods
The first method involved HPLC. This method consisted of digesting the unknown brass in hot nitric acid (HNO3) and diluting it to a certain concentration such that the machine would be able to detect trace amounts of copper and lead in the sample. The copper peak was expected to be visible two minutes into the chromatography while the lead peak was expected at around 12 minutes. The areas of the peaks were proportional to the concentration of either copper or lead in the diluted samples. Due to technical difficulties with the machine, the lead concentration was not analyzed and the copper concentration can also be assumed to be flawed. The reason being is that the column in the HPLC machine which would separate the impurities in our diluted sample was not used because the column itself was contaminated with algae. As noticed before in previous labs, the prepared chemicals and even the DI water contain impurities that would need to be filtered through the column for the data to be relevant. However the method was continued to determine the concentration of copper. 10, 20, and 30 ml standards of unknown brass were prepared and put through the machine to give the peak range between 3121803 nm and 9260405 nm. Then the individually given brass sample dilutes were adjusted so that its sample’s peak would fall in between the standard range. For brass #10, the peak was measured at 7345857 nm. As stated before, the resulting data is flawed and was not analyzed further. Note that HPLC would have been the most accurate of the four methods in determining the copper and lead concentration in brass.
The second method involved flame ionization atomic absorbance spectroscopy. In this method the brass sample was prepared through digestion in hot nitric acid (HNO3) just like in the HPLC method. Then six standard dilution samples were prepared, starting with the blank, to provide a linear calibration curve based on the concentration of analytes vs. the absorbance. The individual diluted brass samples were then put through the machine three times each to obtain the absorbance value. The absorbance values of the unknown samples were able to be analyzed using the line of best fit drawn from the results of the standard samples and their respective unknown concentrations were calculated. The three trials were averaged to give the final concentration of copper and lead in the unknown brass sample using the flame ionization atomic absorbance spectroscopy technique. This method involved atomizing the samples then shooting them into the gas stream of acetylene and the air which would be decomposed by the flame. The absorbance for each sample was measured at log I0/I where I0 denotes the intensity of light reaching the detector when a blank sample meets the flame and ‘I’ denotes the intensity from the sample containing copper or lead.
Gravimetric analysis was used to determine lead concentration in the given brass sample. This method involved quantitative analysis. In this technique, brass was digested in hot nitric acid (HNO3) until all the brass was dissolved. Three samples were used to increase the precision of this technique. The digestions of the three samples were done simultaneously and upon full digestion, the solutions were filtered through a cone filter. Trace amounts of fluffy white precipitate remained on the filter and the resulting solution had a clear, blue color. Sulfuric acid (H2SO4) was added to the samples in order for the precipitation of lead sulfate to take place. Copper and zinc sulfates are soluble so at the end only precipitate remaining in the solution was lead sulfate which was quantitatively analyzed to find its concentration in the unknown brass. After adding the sulfuric acid, the solution was put to boil to eliminate the fumes of SO3 and diluted with distilled water. Once cooled, the solutions were filtered through previously prepared crucibles and cold sulfuric acid was used to wash the filtrate thoroughly so that all of the lead sulfate precipitates were filtered onto the crucibles. The crucibles were prepared earlier by adding a layer of Celite rinsed with dilute nitric acid followed by distilled water and put into the oven for two days to dry. The weights of each crucible were measure and labeled. After the lead sulfate precipitates were filtered onto the crucibles, they were once again put in an oven for a period of time so that it may dry completely. In the end only the lead sulfate precipitate remained in the crucibles and their weights were subtracted by the initial weight of the prepared crucibles to calculate the mass of lead sulfate precipitates inside. The weight percent of lead was obtained using the mass of lead sulfate precipitates and the mass of the unknown sample used for digestion initially. One helpful tip for the future is to write the masses directly onto the crucibles with a pencil because the oven melted the masking tape and turned them black.
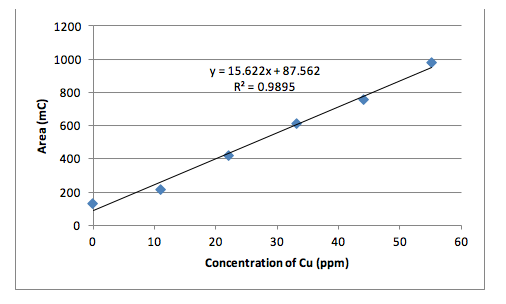
The fourth and the last technique involved anodic stripping voltammetry to determine copper concentration in brass. In this technique, current is used to reduce copper cations in the dissolved brass sample and concentrate them at the working electrode. Then the copper became oxidized as the voltage swept towards a more positive potential and the amount of current flow was proportional to the amount of copper in the solution. A 4% acetic acid was used to prepare all dilute samples for this method. Six standard solutions were made including a blank solution consisting entirely of 4% acetic acid with no copper and the concentrations went up by 11.03 ppm copper until 55.15 ppm. The obtained areas provided the calibration range for the unknown brass samples to fit into for analysis using the calibration curve. As expected, the line of best fit for the standard solutions was linear.
Relevant Chemical Equations
Digestion step for HPLC, AAS, and gravimetric analysis:
3Cu(s) + 8HNO3 (aq) -> 3Cu(NO3)2 (aq) + 2NO (aq) + 4H2O (l)
3Pb(s) + 8HNO3 (aq) -> 3 Pb(NO3)2 (aq) + 2NO (aq) + 4H2O (l)
Lead precipitation reaction in gravimetric analysis:
Pb(NO3)2 (aq) + H2SO4 (aq) -> 2HNO3 (aq) + PbSO4 (s)
Lead nitrate reacts with sulfuric acid to produce the precipitate, lead sulfate.
Results
The HPLC results are flawed. Three calibration solutions for copper with the concentrations of 10, 20, and 30 ppm were prepared and put through the machine to give the HPLC peak range from 3121803 to 9260405. The unknown copper solution was diluted multiple times for its peak to fit within the calibration range and after a few trials, a diluted unknown copper sample with unknown concentration yielded a HPLC peak of 7345857. The results were not analyzed further.
Gravimetric analysis yielded the following concentration for the lead in unknown brass #10.
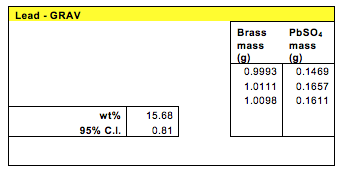
Using this method, the lead concentration in the unknown brass was found to be between 14.87% and 16.47% with 95% confidence interval.
The method of ESV yielded the following values for the standard calibration solutions. The three trials with the unknown solution yielded areas of 395.3, 720.6, and 441.2 in the units of mC.
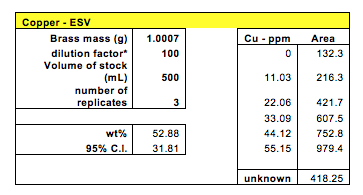
After calculations, the concentration of copper in brass #10 was found to be between the range of 21.07% and 84.69% with 95% confidence.
The AAS method was used to find the concentrations of both copper and lead in the unknown brass sample. Four samples were tested for copper and the absorbance measurements were: 0.1448, 0.1497, 0.1430, and 0.1449. The average absorption was 0.1456.
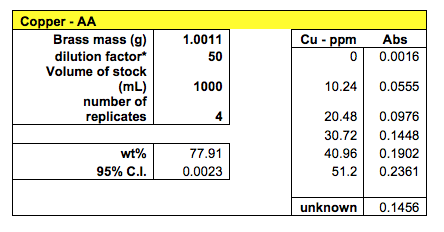
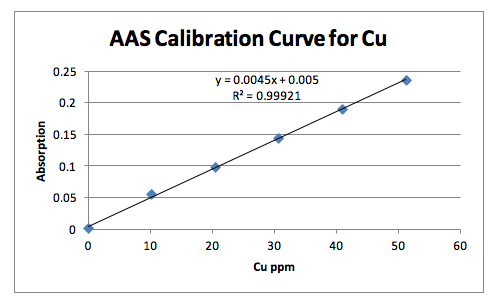
With 95% confidence, the weight percentage of copper in brass #10 was found to be between 77.9077% and 77.9123%
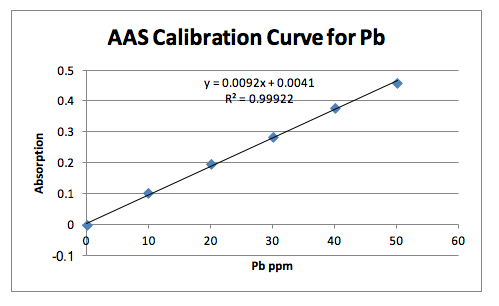
Three samples were tested for lead concentration in brass using the AAS method. The three absorbance measurements were 0.1780, 0.1710, and 0.1636 to give the average value of 0.1709.
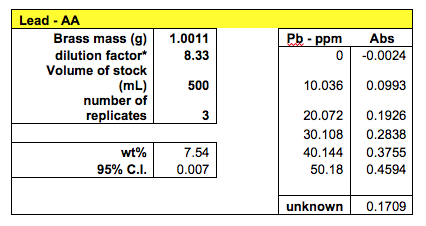
With 95% confidence, the lead concentration in brass #10 was calculated to be between 7.533% and 7.547%
Discussion
Besides the HPLC that gave flawed results, the ESV method also gave questionable values. The calibration curve was linear and expected with an R2 value close to 1. The copper concentration in brass was calculated as 52.88% with a very high confidence interval of 31.81. This is not an acceptable value since the range of possible concentration is too broad. One reason for such high variance is from the small sample numbers. Although three unknown samples were tested, only two area measurements were used because the 3rd was too high compared to the others.
The gravimetric method yielded a lead concentration of 15.68% with a 95% confidence interval of 0.81. This method was preferable because it didn’t involve machines. It was pure quantitative analysis which could lower its accuracy. However the 15.68% lead concentration seems too high considering the fact lead is toxic and usually exists in small traces in the composition of brass.
The AAS method yielded the best results in terms of very low confidence intervals. The calibration curves of the standards were linear with a R2 value very close to 1. 4 samples were tested for copper and 3 samples were tested for lead. This method involved preparing the standard solutions for calibration and preparing the brass solutions through digestion. The measurements were taken from the machine. Using this method, the concentration of copper in brass #10 was found to be 77.91% with the 95% confidence interval of 0.0023. The concentration of lead was calculated to be 7.54% with the 95% confidence interval of 0.007. Analyzing all the methods used, the AAS method proved most reliable in this case for its low confidence interval. If working properly, the HPLC was expected to yield the most accurate values.
Conclusion
Finding the concentrations of copper and lead in brass was best achieved by the AAS method that yielded a low confidence interval. HPLC, AAS, and ESV methods all involved preparing stock solutions of copper and lead for standard calibration curves which was used to find the concentration of the unknown brass solutions. Gravimetric method involved quantitative analysis where the crucible’s masses were used to figure out the concentration of lead present in the brass #10.
