The Determination of Copper in Pennies
The Determination of Copper in Pennies
By: Brooke Carmack
Abstract: The percent composition of copper was analyzed for both pre and post 1982 pennies. This was determined by iodometric titration analysis.
1.0 Introduction:
In this experiment, two pennies were analyzed. One of the pennies was pre-1982 while the other was post 1982. This was performed due to the change in the amount of copper used for pennies after 1982. Pennies before 1982 were made to contain 95% copper and 5% zinc. After 1982, electroplating techniques were used to help the government save money. Due to the high price of copper, the penny was changed to contain 2.5% copper and 97.5% zinc. In our experiment, to determine this copper content of the pennies, they were dissolved in sulfuric acid and an iodometric titration was performed.
Iodometric titration uses the reaction of copper II by the iodide ion. The addition of thiocyanate ensures that this reacts with the starch indicator. The reaction is shown in the following equation:
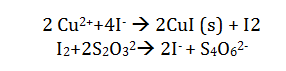
The presence of the starch indicator gives an excess of thiosulfate. The iodine is completely consumed and the starch indicator becomes colorless. This means that if the amount of thiosulfate added is known, the amount of copper present can be determined.
2.0 Procedure:
Standardizing Thiosulfate:
To start off, 0.246 g of pure copper was weight and approximately 5 mL of 6 M HNO3 was added to the copper. The solution was heated until the copper dissolved completely. This took roughly 2-3 hours.
After the copper had dissolved, the solution was cooled and diluted with 25 mL of deionized water. 5 mL of 5% urea was added to the solution, followed by heating the solution to let it briefly boil. This step was necessary to eliminate nitrogen oxides which can come from the nitric aid, which catalyzes the oxidation of iodine. This step is to help increase our yield of our copper content.
The solution was cooled and neutralized with 6 M ammonia until a blue-green precipitate had appeared. This is an important step because it helps assure the solution is not too acidic making the iodide ions undergo an air oxidation and the results for percentage of copper will be lower than the actual content. The pH of the solution was measured using pH paper. This step does allow for slight error, considering that some of the copper is removed when the pH paper test is being performed.
Next, 5 mL of glacial acetic acid was added to the solution to bring the pH to around 4. This will dissolve the precipitate. Then 3.076 grams of potassium iodine was added to the solution, causing it to turn a dark green color. The solution was then titrated with some sodium thiosulfate until the solution became a pale yellow color.
Next, 5 mL of a starch indicator was added making it change from yellow to purple. The solution was further titrated until the solution became a dark gray purple.
Finally, 2.018 grams of potassium thiocyanate was added to replace the iodide ion in a copper iodide. The solution was stirred for approximately 30 seconds. During this time, the solution changed to a dark grey color. Titration was performed until the solution was pale which means that the no iodine complexed with the starch indicator.
Pennies:
The pennies were cleaned, dried and weighed initially giving the following results:
|
Penny |
Weight |
| Pre-1982 | 3.076 |
| Post-1982 | 2.524 |
After the weight was recorded, they were each placed in Erlenmeyer flasks. Approximately 25 mL of 6 M nitric acid was added to each flask and they were placed on hot plates to allow the pennies to dissolve.
The flasks were cooled and 10 mL of sulfuric acid was added to each solution. The flasks wer reheated until white fumes of sulfur trioxide appeared. The flasks were removed from the heat and 6M ammonia solution was added until the copper hydroxide precipitate appeared. The solution became blue and cloudy.
The solutions were titrated as previously described with the only difference being the pre-1982 pennies. Because of the high amount of copper found in these pennies, the solution was diluted in a 250 mL and a 25 mL sample was diluted to use for titration.
3.0 Results and Conclusions:
Copper percentage changed in pennies in 1982. The analysis of copper percentage of both pre and post 1982 pennies was analyzed using iodometric titration and the results of all students was compared.
The experimental values can be compared to the assumed values and error can be discussed. The results of all of the students can be compared to analyze for possible sources of errors.
3.1 Sodium Thiosulfate:
The titration against pure copper standard allows for the determination of the molarity of the sodium thiosulfate solution. This is shown in the following equation:
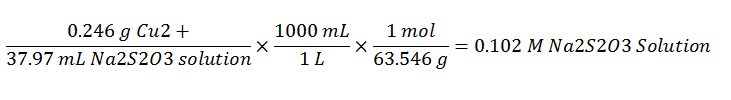
Each of the students performed the calculations based on their experimental data. The average value of the concentration of the standard sodium thiosulfate is 0.102.
| Student | Concentration of Na2S2O3 (M) |
| Brooke | .102 |
| Arie | .107 |
| Aubrie | NO DATA AVAILABLE |
| Paige | .107 |
| La Shyla | .093 |
| Average | .102 |
3.2 Copper Content:
The average value for the percent of copper content in the pre and post pennies was determined.
| Student | Pre-1982 Penny % Copper | Post-1982 Penny % Copper |
| Brooke | 72 | 1.9 |
| Arie | 60.66 | 5.27 |
| Aubrie | NO DATA AVAILABLE | NO DATA AVAILABLE |
| Paige | 72 | 3.3 |
| La Shyla | 375.37 | 6.93 |
| Average | 68.22 | 4.34 |
La Shyla’s data point is an obvious outlier for the pre=1982 penny and will not be considered in the data analysis.
To determine average copper content, the following calculation was made:
3.0 mL Titrant x (1L/1000 mL) x (.102 mol titrant/ 1L) x (1 mol copper/1 mol titrant) x (63.546 g copper/1 mol) x 100 = 1.9%
| Pre-1982 Cu% | Post 1982 Cu% |
| 71.38 | 1.9 |
| 71.56 |
Statistical Analysis Pre-1982
- Standard Deviation:
The standard deviation was determined by taking each value of interest and subtracting the mean from it and then squaring that number. The number obtained is then divided by the degrees of freedom and then taking the square root of that number. This is shown in the following equation:
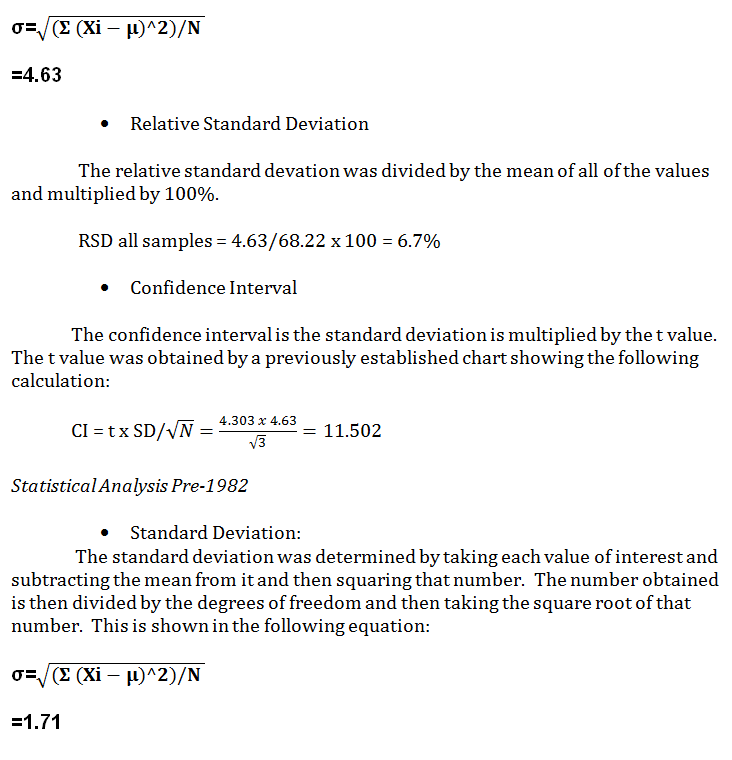
- Relative Standard Deviation
The relative standard devation was divided by the mean of all of the values and multiplied by 100%.
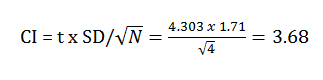
RSD all samples = 1.71/4.34 x 100 = 39.4%
- Confidence Interval
The confidence interval is the standard deviation is multiplied by the t value. The t value was obtained by a previously established chart showing the following calculation:
Conclusion:
My results were within acceptable limits to the department of treasure results. There were many source of error in this experiment. The major contributor was the systematic user error. Because an exact endpoint could not be precisely measured due to the difficulty in the color change, some error was introduced in this experiment. Some samples may have been too heated or left for additional minutes than required. Another source of error is the measuring of the pH of the solution after dissolving the pennies. Each time the pH is read, a small amount of copper is lossed giving a lower value for the pennies.
