Electrochemistry Lab Experiment
Written by Elizabeth
Data:
Table 1: Measured Cell Potential Values
|
Ecell (V) |
|
|
Cu/Zn |
0.920 V |
|
Cu/Pb |
0.646 V |
|
Zn/Pb |
0.423 V |
Table 2: Cell Potential Values for Reduction Half Reactions
|
Ered (V) |
|
|
Cu2+ + 2e– –> Cu |
0.34 V |
|
Zn2+ + 2e– –> Zn |
-0.58 V |
|
Pb2+ + 2e– –> Pb |
-0.31 V |
Table 3: Elements of Cu/Pb Cell in Thermodynamic Study
|
Temp (°C) |
Temp (K) |
ΔGrxn (kJ) |
Ecell (V) |
|
76.0 °C |
349 K |
-157.8 kJ |
0.818 V |
|
66.0 °C |
339 K |
-158.8 kJ |
0.823 V |
|
56.0 °C |
329 K |
-160.2 kJ |
0.830 V |
|
46.0 °C |
319 K |
-161.3 kJ |
0.836 V |
|
36.0 °C |
309 K |
-162.5 kJ |
0.842 V |
|
26.0 °C |
299 K |
-165.0 kJ |
0.855 V |
|
20.4 °C |
294 K |
-165.8 kJ |
0.859 V |
Graph 1: Gibbs Free Energy vs. Temp (K)
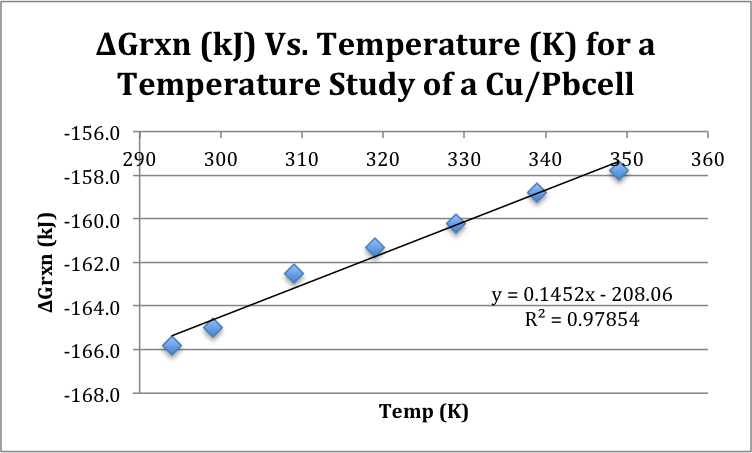
Table 4: Elements of Gibbs Free Energy Derived from Graph 1
|
ΔH (kJ) |
ΔS (J) |
|
-207.73 kJ |
-144.1 J |
Table 5: Change in Enthalpy based on Equation (5)1
|
Temp (K) |
ΔGrxn (kJ) |
ΔH from substitution (kJ) |
|
339 K |
-158.8 kJ |
-207.6889 kJ |
|
319 K |
-161.3 kJ |
-207.3159 kJ |
|
299 K |
-165.0 kJ |
-208.1009 kJ |
Discussion:
In this experiment, voltmeters were used to take readings of three different electrochemical reactions (Cu/Zn, Cu/Pb, and Zn/Pb). The voltage of a reaction containing two metal strips in separate aqueous solutions, with a salt bridge in between to balance charge as the reaction progressed. The voltage reading for Cu/Zn, Cu/Pb, and Zn/Pb were .920 V, .646 V, and .423 V respectively. These values were then used to determine the half reaction voltage of the reduction half reactions, which contained the metals that were attached to the positive alligator clip of the voltmeter. The reduction cell potentials of Cu, Zn, and Pb were calculated to be .34, -.58 and -.31 respectively. It appears that according to the data, the experiment was successful up until this point. No appreciable error occurred in reference to Tables 1 and 2. However, when the experiment moved to the portion of the experiment measuring temperature vs. cell potential, the experiment became inaccurate quite quickly.
The second portion of the experiment involved measuring the voltage of a Cu/Pb cell at different decreasing temperatures of solution. In theory, as the temperature decreased, the voltage would have decreased as well. The natural movement of the electrons is closely related to the Gibbs Free Energy of the reaction; that is, as Gibbs Free Energy becomes more negative (and therefore more spontaneous), the movement of the electrons should decrease, as seen in Table 3. However, this change should be occurring at the temperature increases; in the given experiment, this relationship occurs to be flipped, with the voltage increasing and the Gibbs Free Energy becoming more spontaneous as the temperature decreases. As is apparent in Graph 4, this set of data gives a positive slope (144.1 J), when in fact, in a graph of Gibbs Free Energy vs. Temperature, the slope should be negative, because the two should be inversely related.
Unfortunately, the consequences of having such unreliable data were, in a word, catastrophic. Because the change in entropy of the reaction was calculated directly from the slope of the graph, this data was then derived as being “backwards” as well. When the change of enthalpy was compared to the change in entropy, you can see that both appear to be negative. This would mean that based on the results collected, that the reaction is only spontaneous at low temperatures. It is known, however that the reaction should be, given reliable data, spontaneous at all temperatures. This then consequently affected the Gibbs Free Energy, and led the experiment to a very dissatisfying end.
It became apparent during the experiment that enormous error occurred in the portion regarding temperature and change in cell potential. It appears that the functionality of the voltmeter was not correct, therefore giving results that were not accurate. The voltmeter may have just been designed incorrectly, leading it to malfunction, or perhaps the battery was dying during the experiment, so it was reading the voltage incorrectly. Whatever the case may be, a simple way to rectify the situation would be to try the experiment again with a brand new voltmeter (so that you may be certain that the battery is not worn down). Given the use of a fully functional voltmeter, it is extremely possible that another trial of the experiment might yield more accurate results.
Conclusion:
The purpose of this experiment was to demonstrate the different relationships between cell potentials and the various values that are calculated with the cell potential value. The cell potential of three reactions (Cu/Zn, Cu/Pb, and Zn/Pb) were measured giving a cell potential of .920, .646 and .423 V, respectively. The reduction potentials of Cu, Zn and Pb ions were then calculated to be .34, -.58, and -.31 respectively. The voltage of a Cu/Pb cell was then measured at different temperatures and then used to calculate Gibbs Free Energy, which was graphed vs. the temperature in Kelvin. This gave a slope of 144.1, although it is clear that this is incorrect, because as temperature decreased, Gibbs Free Energy should increase, giving a negative slope. Never the less, this slope was used to find a negative change in entropy value, which led to a cell which is only spontaneous at low temperatures. This should not be the case for a Cu/Pb cell, and thus, some appreciable error must have occurred. This error most likely occurred due to a problem with the voltmeter. The mechanism may have just been faulty from the beginning, or perhaps the battery was dying during the experiment. Either way, performing the experiment again with a new voltmeter would most likely solve the issues related to this experiment. Regardless of the error that occurred, and the consequent inaccurate results, the relationship of cell potential to half-cell potential, Gibbs Free Energy, enthalpy and entropy was well represented, and from that point of view, the experimental goals were met, yielding the experiment to be a success.
Sources:
Electrochemistry. S126 Lab Handout. Date Accessed, 17 April 2013. 1
Tro, Nivaldo J. Chemistry: A Molecular Approach. Upper Saddle River, N.J.: Pearson
Prentice Hall, 2011. Print. 2
