Equilibrium
I. Purpose
To study how stress affects a system’s equilibrium and to determine the concentration of the complex ion in solutions of unknown concentration as well as the equilibrium constant.
- Procedure
LeChatelier’s Principle
Part 1
Solid sodium chloride was poured into a test tube and the test tube was then filled ¾ full of distilled water. The solution was then decanted into a second test tube and Cl– ions in the form of concentrated HCl were added.
Part 2
A small test tube was filled about half full of distilled water. Several drops of bromthymol blue indicator solution and 5 drops of 0.1 molar hydrochloric acid were added, and the resulting color was noted. 0.1 molar sodium hydroxide was then added drop by drop with stirring until no further color changed occurred. The color was then noted. The attempt was then made to add the right about of acid to the test tube to cause the solution to be green in color after stirring.
Part 3
About 25 mL of 0.0020 molar KSCN solution was poured into a beaker. 25 mL of distilled water and 5 drops of 0.20 molar Fe(NO3)3 solution were then added and swirled. The color of the KSCN and Fe(NO3)3 solutions were noted, as well as the color of the resulting complex ion. Equal amounts of the solution were poured from the beaker into four test tubes. The solution in the first test tube was the reference solution. To the second test tube 2-3 crystals of KSCN were added and the results were described. To the third test tube 6 drops of Fe(NO3)3 solution were added, and the solution was stirred and the results noted. To the fourth test tube small crystals of Na2HPO4 were added a few at a time and stirred into the solution; the results were noted.
Part 4
About 10 mL of ethanol was measured in to a beaker. Solid cobalt (II) chloride was examined, with its color and formula noted, then a small amount was dissolved in the beaker of ethanol. About 2 mL of the alcoholic cobalt solution was added into each of 3 small test tubes. To the first test tube, 3 drops of distilled water were added, one drop at a time with stirring. 3 drops of distilled water were added to the other 2 test tubes and the effect was noted. Using the first test tube as a control, 5 drops of 12 molar HCl was added one drop at a time with stirring and the result was noted. To the third test tube a few crystals of sodium chloride were added and stirred. The remainder of alcoholic cobalt solution from the beaker was put into a fourth test tube. 10 drops of 0.1 molar silver nitrate solution were added one drop at a time, and the color of the solution was noted. A sealed Beral pipet containing some of the alcoholic cobalt chloride-water system was obtained and the large end of the pipet was immersed in some hot water and the color change was noted. The Beral pipet was then chilled in an ice bath to see if the color change in the previous step was reversible.
Equilibrium Constant of FeSCN
Part 1
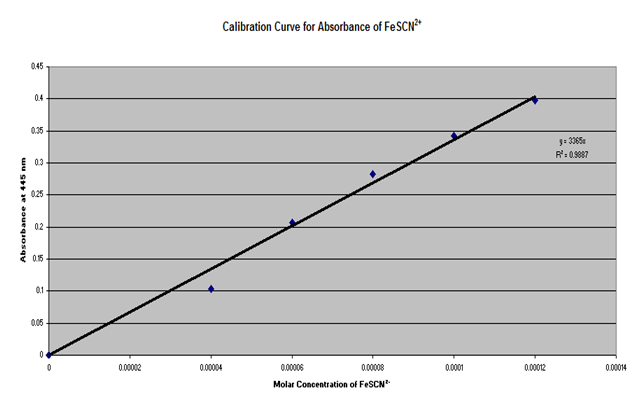
Using burets or pipets, 2.0, 3.0, 4.0, 5.0, and 6.0 mL of 2.0 X 10⁻³ M KSCN in 0.50 M HNO3 was measured into 100 mL volumetric flasks and diluted to 100 mL with 0.20 M Fe(NO3)3 in 0.50 M HNO3 and mixed well. The concentration of FeSCN in each flask was then calculated, assuming the all of the SCN had reacted. The absorbance of each of the standard solutions were measured at 445 nm, using distilled water as the reference in the spectrophotometer. The molar concentration of FeSCN was then plotted against absorbance and the best fitting line was drawn through the data points.
Part 2
Using a buret or pipet, the following quantities were measured into 5 test tubes. The solutions were mixed well with a glass rod and the absorbance of each was measured at 445 nm using distilled water as a reference.
|
Solution |
2.0 X 10⁻³ M Fe(NO3)3 in 0.50 M HNO3 |
2.0X10⁻³ M KSCN in 0.50 M HNO3 |
0.50 M HNO3 |
|
1 |
5.0 mL |
1.0 mL |
4.0 mL |
|
2 |
5.0 mL |
2.0 mL |
3.0 mL |
|
3 |
5.0 mL |
3.0 mL |
2.0 mL |
|
4 |
5.0 mL |
4.0 mL |
1.0 mL |
|
5 |
5.0 mL |
5.0 mL |
0.0 mL |
II. Data
LeChatelier’s Principle
Part 1
A white solid precipitated at the top of the test tube.
Part 2
The result of step 1 is a yellow solution. The number of drops of acid needed to create a lime green color is 40 drops.
Part 3
KSCN is a colorless solution. Fe(NO3)3 is a purple solid. The second test tube was blood red, the third test rube was a burnt orange color, the fourth test tube was clear, and the resulting complex ion was an orange color.
Part 4
Step 8 caused the solutions to become more purple. Step 9 caused the solution to become bright blue. When placed in an ice bath, the solution turned pink. When placed in a hot water bath, the solution reversed back to blue.
Equilibrium Constant of FeSCN
Part 1
|
Solution |
mL 2.0*10-3 M KSCN in 0.50 M HNO3 |
% Transmittance |
Absorbance |
Concentration FeSCN, M |
|
1 |
2.0 |
78.9 |
0.103 |
4.0 X 10⁻⁵ |
|
2 |
3.0 |
62.1 |
0.207 |
6.0 X 10⁻⁵ |
|
3 |
4.0 |
52.1 |
0.283 |
8.0 X 10⁻⁵ |
|
4 |
5.0 |
45.5 |
0.342 |
1.0 X 10⁻⁴ |
|
5 |
6.0 |
40.0 |
0.398 |
1.2 X 10⁻⁴ |
Part 2
|
Solution |
mL 2*10-3 Fe3+ in 0.50 M HNO3 |
ML 2*10-3 SCN– in 0.50 M HNO3 |
% Transmittance |
Absorbance |
Initial moles Fe3+ |
|
1 |
5.0 |
1.0 |
97.5 |
0.009 |
1.0*10-5 |
|
2 |
5.0 |
2.0 |
94.1 |
0.024 |
1.0*10-5 |
|
3 |
5.0 |
3.0 |
91.0 |
0.039 |
1.0*10-5 |
|
4 |
5.0 |
4.0 |
87.3 |
0.052 |
1.0*10-5 |
|
5 |
5.0 |
5.0 |
85.9 |
0.065 |
1.0*10-5 |
|
Solution |
Initial moles SCN- |
Concentration FeSCN2+, M |
Moles FeSCN2+ at Equilibrium |
Moles Fe3+ at Equilibrium |
Moles HSCN at Equilibrium |
|
1 |
2*10-5 |
2.7*10-6 |
2.7*10-7 |
9.7*10-6 |
2.0*10-5 |
|
2 |
4*10-5 |
7.1*10-6 |
7.1*10-7 |
9.3*10-6 |
4.0*10-5 |
|
3 |
6*10-5 |
1.2*10-5 |
1.2*10-6 |
8.8*10-6 |
5.9*10-5 |
|
4 |
8*10-5 |
1.5*10-5 |
1.5*10-6 |
8.5*10-6 |
7.9*10-5 |
|
5 |
1*10-4 |
1.9*10-5 |
1.9*10-6 |
9.8*10-5 |
9.8*10-5 |
|
Solution |
Concentration HSCN at Equilibrium, M |
Concentration Fe3+ at Equilibrium, M |
Concentration H+ at Equilibrium, M |
Equilibrium Constant Kc |
|
1 |
2.0*10-4 |
9.7*10-5 |
0.50 |
70 |
|
2 |
4.0*10-4 |
9.3*10-5 |
0.50 |
95 |
|
3 |
5.9*10-4 |
8.8*10-5 |
0.50 |
116 |
|
4 |
7.9*10-4 |
8.5*10-5 |
0.50 |
112 |
|
5 |
9.8*10-4 |
9.8*10-5 |
0.50 |
99 |
Average Kc = 98
IV. Calculations
Equilibrium Constant of FeSCN
(See Data section for complete list of final calculation answers)
Part 1
Concentration of FeSCN
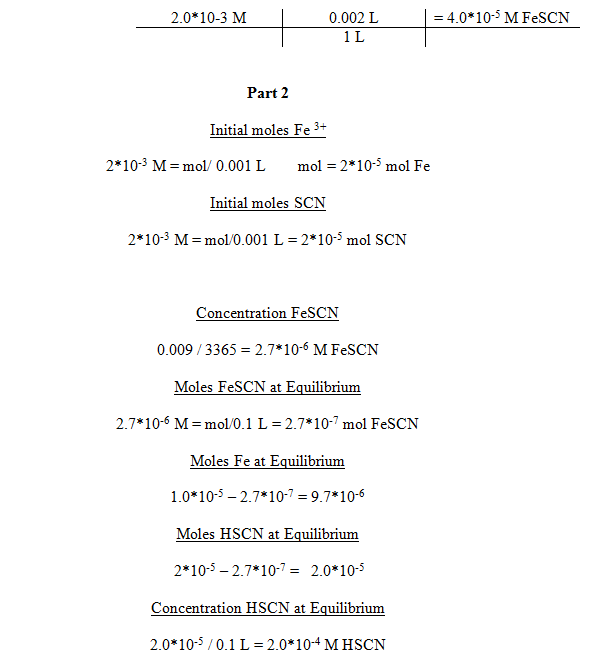
Concentration Fe at Equilibrium
9.7*10-6 / 0.1 L = 9.7*10-5 M Fe
Equilibrium Constant

V. Conclusions and Error Analysis
LeChatelier’s Principle
In this experiment the effect of stress on a system’s equilibrium was observed. As more HCl was added in the second part, the equilibrium shifted to move the reaction in the reverse direction. In the third part, the color of the solution shifted as more of either KSCN or Fe(NO3)3 were added, shifting the equilibrium. In the fourth part, the effect of temperature on equilibrium was observed. As the solution sat in the ice bath, it turned pink because equilibrium shifted in the reverse direction because it had a ΔH of 50 kJ/mol. As the solution warmed back up in the hot water bath, the reaction shifted again to favor the products. In the first part of the experiment, the effect of a change in concentration was observed. The HCl that was added reacted with the sodium chloride to form more solid sodium chloride on the top of the solution do to over-saturation.
Equilibrium Constant of FeSCN
The average Kc obtained was . From the data it can be concluded that the concentration of FeSCN is inversely proportional to the absorbance and directly proportional to the amount of SCn used as a reactant.
Based on the obtained R2 value of it can be inferred that only a small amount of error was obtained up to this point. However, some explanations for the small amount of error that did occur are not setting the features of the Spec 20 correctly, contamination of the chemicals, and aging of the chemicals. If the chemical were aged or contaminated, this would affect the molarity and therefore the absorption. If the settings on the Spec 20 were incorrectly adjusted, this would affect the absorption number obtained. If an error was made in the calculation for the concentration of FeSCN using the data from the graph, this would affect the calculated number of moles of FeSCN, and therefore affect the calculations of the number of moles and concentrations of the Fe and SCN, as well as the Kc value.
Ways to prevent these types of error are to double check the Spec 20 settings before use and to use only fresh chemicals to avoid aging and impurities.
Because 100. mL of solution was mixed in a volumetric flask after being measured in a graduated cylinder, some of the solution may have been retained in the cylinder and was therefore unable to react with the other chemicals in the solution, which would affect the absorbency. Because such small quantities of solution were used in part 2, any error in measurement would greatly affect the absorption.
Some ways to avoid this type of error are to be as accurate as possible when measuring and making allowances in calculations for lost or spilled solutions.
VI. Discussion of Theory
Equilibrium occurs when the forward reaction and the reverse reaction are acting at the same rate. In the first experiment, the effects of temperature, saturated solutions, and the addition of more of either reactants or products were observed. As stress is applied to a system, the system responds accordingly in order to maintain a state of equilibrium. For example, if an endothermic reaction were cooled, the reaction would shift in favor of the reactants in order to relieve the stress, as demonstrated in the following equation:
![]()
In the second experiment, the equilibrium constant was determined for a reaction taking place in solutions of unknown concentration. The average calculated value of the equilibrium constant (98) is relatively high, which indicates that the reaction’s equilibrium favors the products side of the reaction as shown in the following equation:
![]()
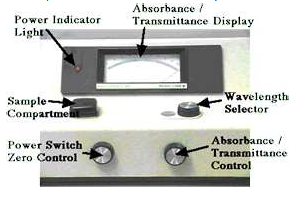
A spectrophotometer is an electronic device that measures the absorbance and percent transmittance of a solution by comparing the light waves accepted by the standard solution to the control solution (in this case distilled water). The standard solutions were obtained by diluting particular amounts of a solution of known molarity in order to obtain a percent transmittance. The molarity of the diluted solution is then obtained by using the formula M1V1 = M2V2, which is
then plotted against the absorbance to produce a calibration curve graph. This graph is then used to calculate the number of moles and concentrations of the FeSCN, Fe, and SCN solutions, as well as the Kc values. Three significant figures including one estimated digit can be obtained using the spectrophotometer. The major source of error that stems from using the apparatus is that it can be unreliable if the absorption is measured using the device rather than calculating it from the percent transmittance. Other experiments in which a spectrophotometer would be useful are those which are designed to determine a chemical substance’s identity by using the color transmitted by its electrons.
Throughout the experiment, 0.5 molar nitric acid was used in all solutions in order to maintain a constant molarity of H+. If a higher concentration of nitric acid had been used, this would have caused the Kc value to increase due to the fact that the hydrogen was a product, and therefore a numerator in the Kc calculation.
