Fluorescence Spectrophotometry of Riboflavin
Fluorescence Spectrophotometry of Riboflavin
By: Andrew Tam
Introduction
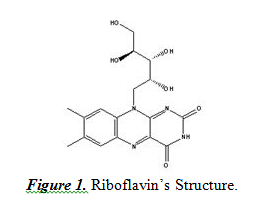
This experiment was done to explore an aspect of spectroscopic analysis called fluorescence. This aspect involves shining an ultraviolet light, which will excite the electrons of certain molecules. When these excited electrons returned to their ground (original) state, energy is released and causes the molecule to emit light. This light can then be captured with the use of a detector to measure how intense the compound emits light as a result of this stimulus. We were able to perform this experiment with an Ocean Optics spectrophotometer. The compound of interest for this experiment is riboflavin. Riboflavin is an essential vitamin that is found in many commercial multivitamin preparations. It is important in energy metabolism as well as helping the body maintain a healthy condition. By studying its properties, we can further our understanding of this substance so that it can aid us in the future. Riboflavin’s structure is shown below in Figure 1:
This analyte, the riboflavin, will be studied by analyzing the emission spectrum out of the spectrophotometer. It should be noted that riboflavin must be reacted with acetic acid to become fluorescent. Another important aspect of fluorescence spectrophotometry is that the detector is at a right angle to the ultraviolet light used to excite the compound’s electrons. This is done so that the light source does not affect the fluorescence reading, as the detector cannot distinguish the source’s light from the analyte’s emission. With the readings, there will be a calibration curve created by the fluorescence reading against the concentration of riboflavin. This curve is very similar to a calibration curve of absorbance vs concentration, where it should show a positive linear relationship. This curve allows us to study different concentrations of riboflavin.
Results and Discussion
A calibration curve was used to study concentration (in units of ppm) based on the fluorescence result. We also determined the wavelength with maximum fluorescence to take fluorescence readings. We decided that this maximum wavelength value would be 527.612 nm. We took readings from five different concentrations of riboflavin: 2, 4, 6, 8, and 10 ppm. By doing three trials for each concentration, we get the following calibration curve in Figure 2.
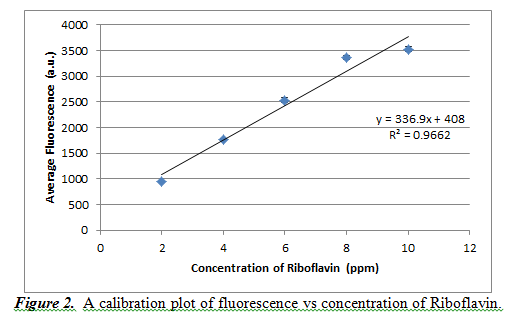
From Figure 1, we can see that the resulting calibration plot is practically linear, but not perfectly (it has an R2 value of 0.9662). The slope of the line is 336.9±36.4, and the y-intercept is 408±241.1. These high values of standard deviation show that our averages were not very precise and a better calibration curve could have been created. It should also be noted that the error bars for this calibration curve are in fact present, but on a scale too small to be visible with this curve.
Our next goal was to determine the amount of riboflavin in a Women’s One-a-day tablet. We got values of 2861, 2594, and 2767 for the fluorescences at weights of 0.6117, 0.5926, and 0.5899 g of tablet (each of these are roughly one third of a tablet). The tablet’s mass was 1.8391g. Substituting these values into the calibration plot we created, we get concentrations of 7.281, 6.489, and 7.002 ppm. Ppm has units of 1mg/L of solution. In order to find out the concentration of riboflavin in a tablet from our three samples is using the following equation (1).
(1) ppm * (mg/L)/ppm * 0.1L * Tablet mass/sample mass = amount of riboflavin per tablet
We have the 0.1L part to show that we dissolved the tablet samples in 100 mL of acetic acid. Following equation (1), we get riboflavin amounts of 2.189, 2.014, and 2.183 mg per tablet. Averaging these values, we get a result of 2.129±0.099mg per tablet. We then must create a 95% confidence interval to evaluate our data. We must use the following equation (2) for this.
(2) Confidence interval = [x̄ – ts/(n0.5) , x̄ + ts/(n0.5)]
We use the t value of 4.3 because it is the value for 95% confidence level and the degrees of freedom value (n-1 = 3-1 = 2). Our s value is 0.099 and x̄ is 2.129. With this, we get a confidence interval of [1.882, 2.376] mg.
The manufacturer claimed the tablet to contain 1.7mg per tablet. Using equation (3), we can get the percent error of our value.
(3) %error = |exp value – true value| / true value
With the true value at 1.7 and our value at 2.129, we get a result of 25% error.
Next, we must figure out the riboflavin concentration in an unknown sample given to us. Our sample was number #16. We got fluorescence values of 2344, 2344 and 2319. These values, when substituted into the calibration equation we got earlier, we get ppm values of 5.747, 5.747, and 5.672 ppm. However, we diluted our unknown by a factor of ten because the original fluorescence was higher than our value at 10ppm for the calibration plot. Therefore, the actual concentration values are 57.47, 57.47, and 56.72 ppm. With these values, we get a final experimental value of 57.22±0.43 ppm. Again, we must also construct a confidence interval for this part of the experiment. We use equation (2), with the same factors except our values of x̄ and s. We then get a 95% confidence interval of [56.15, 58.29] ppm.
Finally, to validate our experiment, we constructed a sample overlay emission spectra for the 10ppm standard, vitamin tablet and unknown sample. It is shown below in Figure 3.
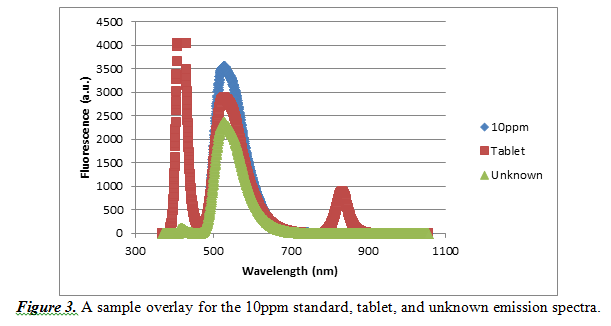
As observed by this overlay, there is a common maximum fluorescence at a wavelength of approximately 527.612nm. Every other emission spectrum looked similar to this sample overlay, so it is acceptable that we used the wavelength of 527.612nm for our observations.
Conclusions
This experiment was done to observe and study fluorescence, spectrophotometry, and riboflavin. A calibration graph was constructed to show the linear relationship between fluorescence and concentration of a riboflavin sample. We also did this experiment to attempt to determine the amount of riboflavin present in a Women’s one-a-day tablet. It was also possible to determine the concentration of an unknown sample and to adequately study aspects of riboflavin.
There are several sources of errors in this experiment. First, the tablet that we studied may contain other compounds that also would fluoresce when reacted with the acetic acid and have the ultraviolet shined upon them. It should be noted that these structures would be similar to riboflavin, which means it would fluoresce the most at wavelengths similar to riboflavin. This would have increased our fluorescence readings and, in turn, caused our ppm result to be higher than expected. It is also possible that some light from the light source could have reached the detector, therefore adding to the readings. Finally, another source of error is light leaking into the detection chamber, as outside light will add to the readings, which will increase the fluorescence result and, as a result, increase our ppm values.
There were also some differences observed between the different emission spectra. For the vitamin samples, there were some other peaks. These peaks most likely represent other compounds present in the tablet as well as some leftover undissolved parts of the tablet. Also, the spectra differ at fluorescence values because they are all at different concentrations of riboflavin.
