Quantum Dot Nanocrystals Experiment
By: David Gould
Partners: Alaina Nunn, Stephanie Bolini
CHEM 322L | February 17, 2014 – Quantum Dot
Abstract:
This experiment works to determine how quantum dots are prepared in a laboratory setting, and their analysis spectroscopically. With uses as semiconductors in the electronic industry, quantum dots perform faster due to their small size. Being so small these nanoparticles do not obey the laws of classical physics and must be studied in the quantum realm. Various quantum mechanical models are discussed and it is explained as to why these small particles can have such versatility. Uses in fields other than electronics are discussed, as well as research into the future of quantum dots.
Introduction:
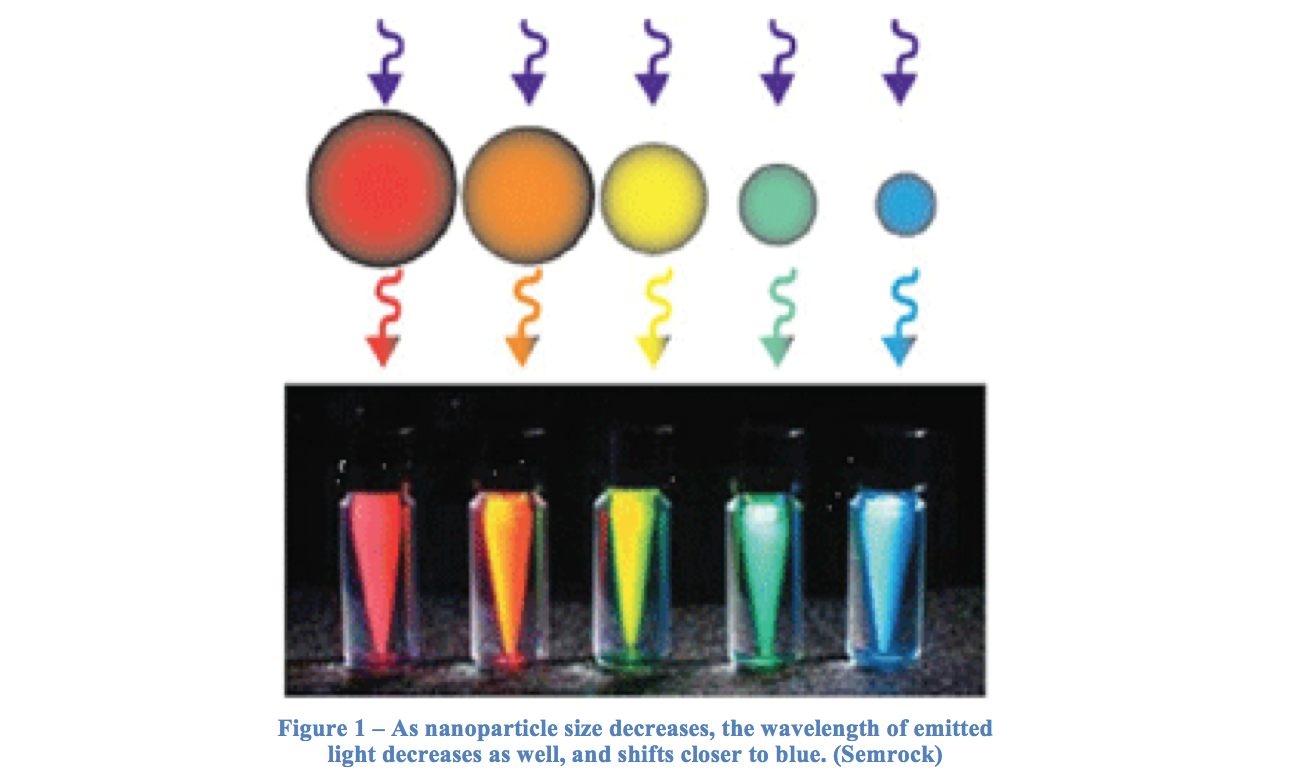
Quantum dots are small particles that can behave as semiconductors, and are arranged as nanocrystals. Particles usually range from 2 to 10 nm in diameter, and because of this small size quantum dots can exhibit unique properties, notably optic and electric (Nanoco). Quantum dots can be synthesized to a desired size, creating specific uses for their variability. The size of the quantum dots also affects the wavelength of light given off when excited, and therefore their color. This is so because the band gap is inversely related to the size of the dot – a smaller band gap, relating to a lower energy, will have a higher wavelength. Therefore, a large quantum dot with a small band gap gives off a higher wavelength, and is closer to the red end of the visible spectrum than a smaller dot. A selection of varying quantum dot colors is shown in Figure 1.
A quantum dot can also be treated as a particle in a box to study many of its features. When an electron in excited by a photon, it jumps to a new position called the conduction band, leaving a positive hole in the area it resided in previously. It is the energy difference between these two levels that makes up the band gap mentioned earlier.
Since the color of the nanoparticle and the size of the band gap depend on the quantum dot’s size, the electronic states of a particular size of nanoparticle can be studied. Another topic of special interest is a quantum dot’s relation to the Bohr radius, which for the Cadmium Selenide being studied in this experiment is 56 angstroms. As quantum dots approach and are below this Bohr radius, they are of such a small size they can fit within the lattice structure of the nanocrystals, and are said to be confined. This is known as quantum confinement, which causes the energy levels to be discrete, and decreasing in size as they increase in number, as well as when the particle increases in size.
Quantum dots have seen much use in recent years, especially in biological research. Due to their wide range of flexibility – stemming from a nearly endless range of colors and particle sizes – quantum dots have begun replacing organic dyes in cellular imaging processes (Alamos). There is also being much done relating to locating tumors using specific sizes to bind more effectively than what is currently available.
Also, although the materials of quantum dots are generally inorganic compounds, they can be inserted into the body by first coating them with a special organic material. This allows for more efficient delivery, and to be directed to the specific site they will act on. This allows for efficient drug delivery, tissue mapping, detection of intra-cellular events, and many more, with research being done regularly (Nanoco).
Experimental:
Solution Preparation
While wearing nitrile gloves for protection, 13 mg of cadmium oxide was weighed and placed in a 10 mL Erlenmeyer flask. To this, 0.6 mL of oleic acid and 4.5 mL of octadecene was added – these serve to stabilize the nanocrystals’ growth. In this solution, a thermometer and small magnetic stir bar were added, and placed on a hot plate, to be heated to 225°C.
For the second solution, 30 mg of selenium power was weighed out and added to a second 10 mL Erlenmeyer flask. 5 mL of octadecene and 0.2 mL of tributyl phosphine were then added, the latter being done by the instructor with a special syringe and an airtight container, due to its extreme danger with handling. A magnetic stir bar and thermometer were added to this mixture as well, and heated to 150°C on a hot plate. This solution was then allowed to cool to room temperature before use, and it was made sure that all of the selenium was properly dissolved.
Using as much care as possible, two glass Pasteur pipettes were calibrated for 0.5 and 1.0 mL. This was done by filling a graduated cylinder with water and drawing up precisely the right amount in the glass pipette, with no air bubbles. Before releasing the pressure on the pipette bulb, a mark was made on the pipette with a wax pencil.
With an Eppendorf pipette, 2.0 mL of octadecene was placed in six clean test tubes. A square of parafilm was cut for each, and the test tubes then set aside to be used in the next part of the experiment.
Using the now-calibrated pipettes, 1 mL of the room temperature selenium solution was transferred to the hot cadmium oxide solution, and a stopwatch was started to begin timing immediately following the addition. After 10 seconds, 0.5 mL of the solution was taken and placed in one of the ready test tubes. The same was done for total elapsed times of 20, 30, 40, 60, and 180 seconds. Each test tube was then covered with the parafilm and shaken to mix completely.
The excess reagents were stored in the hood to be used for a later lab session. All solutions involved in the actual experiment were disposed of in their proper waste containers also in the hood.
Spectroscopic Analysis
Using the lab’s Cary-50 UV/Vis spectrophotometer, the visible absorption spectrum was obtained for each of the six solutions. The range the spectrometer was set to scan for was between 300 and 800 nm. The data were saved as a .CSV file onto a floppy disc, and transferred via floppy disc to be exported to an Excel spreadsheet using a separate computer.
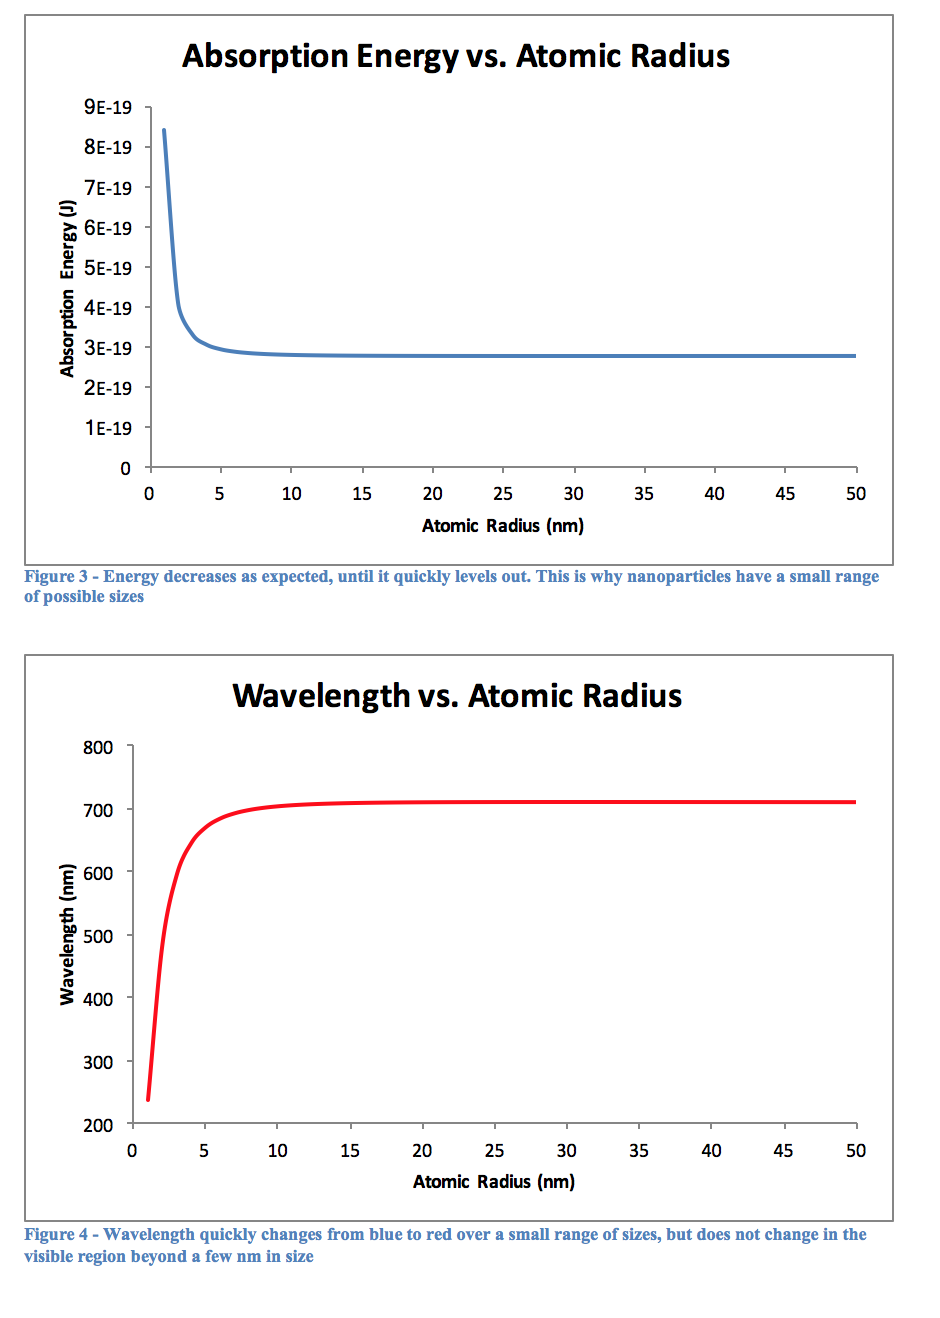
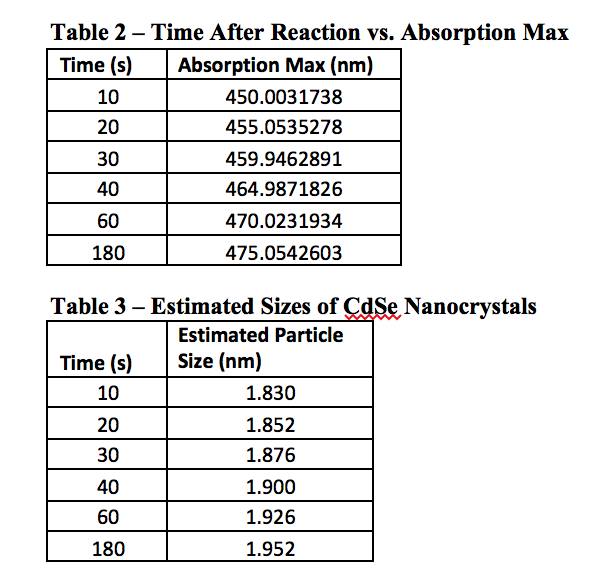
The above figures and tables reinforce the previously mentioned fact that quantum dots typically do not exceed 10nm in diameter. Looking at Figures 3 and 4, it is obvious that there is very little change once the atomic radius is greater than about 5 nm, or a diameter of 10 nm. Beyond this, the particle is likely too big to behave appropriately in the quantum realm, however small it may seem to us. At this size the quantum mechanical equations must break down, and classical physics would have to step in to explain its actions.
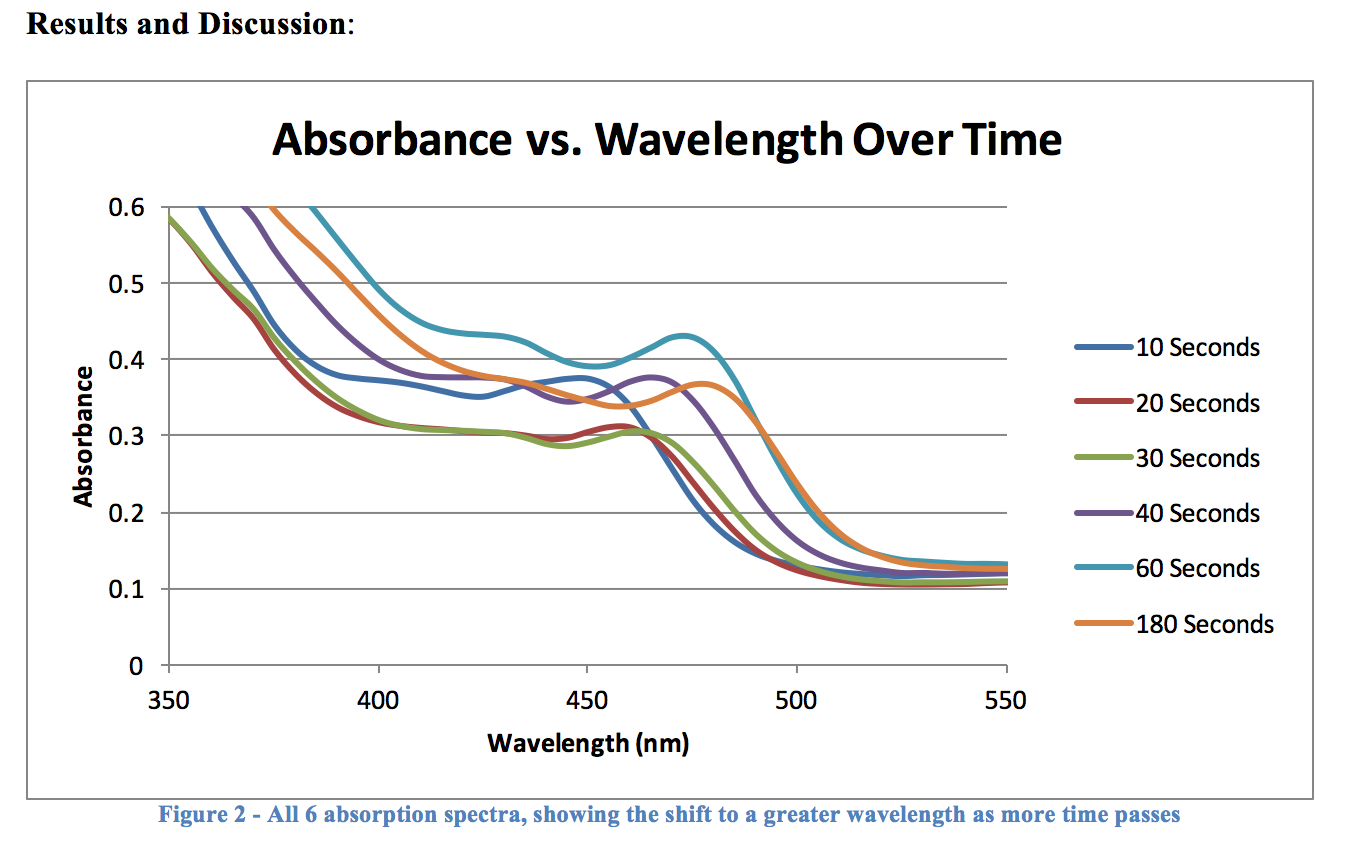
The graph in Figure 2 may be somewhat hard to make out, but it does plainly show that there is a bathochromic shift as a particle has more time to react, and grow. The intensity of each graph varies quite a bit, but this is nothing to worry about, or even pay attention to – all that matters here is that the maximum absorbance is clearly increasing, which is exactly what we set out to prove in this experiment.
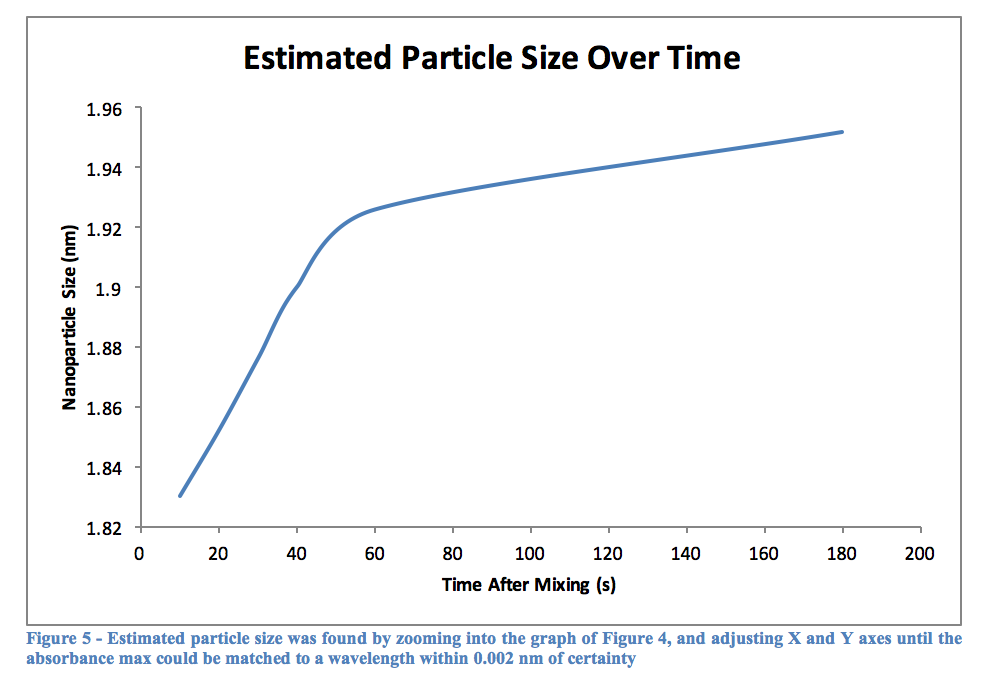
As can be seen from Table 2, the longer a quantum dot has to react in the heated mixture, the greater its wavelength will be. This would logically relate to a large particle after more time had passed, and Table 3 confirms this as well. The graph of Figure 5 shows this as well, that over time a particle will become larger. Perhaps it was the reagents used, or the temperature the experiment was performed at, but the graph quite clearly begins to level out around 2 nm, although this is not for sure as the experiment only went up to 180 seconds of reaction time. Using other, perhaps more stabilizing reagents may lead to creating larger particles, and therefore quantum dots with a more reddish color, as opposed to the varying shades of yellow we observed.
Without an actual equation to use, Table 3 was made using Table 2 and Figure 4. The graph was increasingly zoomed in on and adjusted until it contained only the wavelengths listed in the table, and gridlines were added that allowed the matching wavelength to be found and confidently measured to about 0.002 nm.
Conclusion:
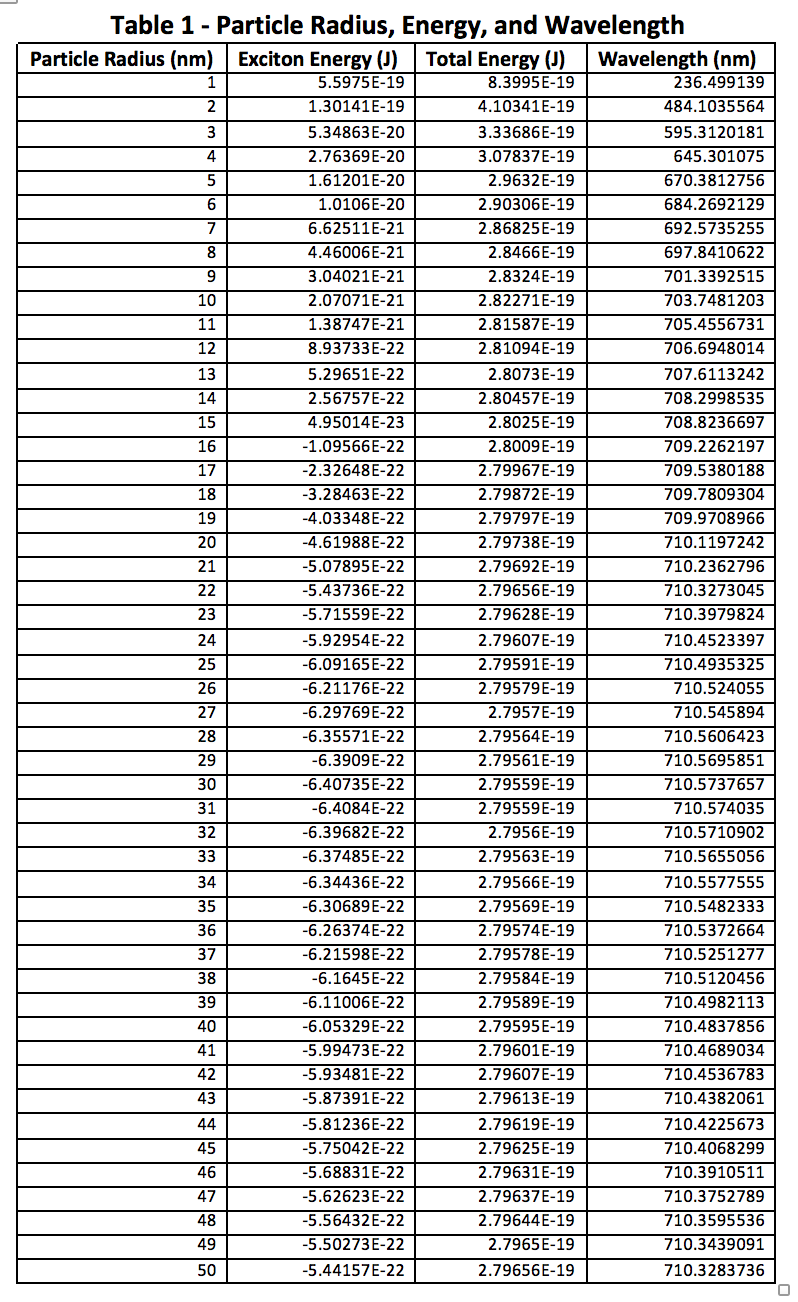
The quantum dots experiment seemed to go very well, and all of the data clearly supports a larger particle size being associated with a longer wavelength. The first table also shows that this is equivalent to less energy needed to excite an electron, hence the longer wavelength observed. Longer time in the reaction mixture before sampling gives the particles more time to react and increase in diameter, but it seemed to reach a leveling off point, likely due to the lab conditions. Done with different nanocrystal elements, a completely different range of wavelengths could likely be achieved. This may be something to do in future experiments, and determine whether one set of reagents can achieve a wider range of wavelengths than the CdSe used here.
Another key observation is the breakdown of quantum mechanics as objects become too large and enter the realm of classical physics. Each graph seems to trail off quite quickly, showing little change when the size becomes too great. A better model is clearly needed that can explain these particles over a wider range of sizes, but until then classical physics equations must be switched too once it is seen that something is no longer behaving as a proper quantum model should.
References
Alamos, L. (n.d.). Nanotechnology and Advanced Spectroscopy Team . Retrieved March 14, 2014, from http://quantumdot.lanl.gov/
Nanoco. (n.d.). Quantum dots – background briefing. Retrieved March 15, 2014, from http://www.nanocotechnologies.com/content/AboutUs/AboutQuantumDots.aspx
Pagano, J. (2014). Physical Chemistry II Lab Manual. University Center.
Semrock. (n.d.). Retrieved March 15, 2014, from Fluorescence Imaging with Quantum Dot Nanocrystals : http://www.semrock.com/fluorescence-imaging-with-quantum-dot-nanocrystals.aspx
