Spectra and Molecular Structure – HCl & DCl
Spectra and Molecular Structure – HCl & DCl
By: Christopher T. Hales
ABSTRACT:
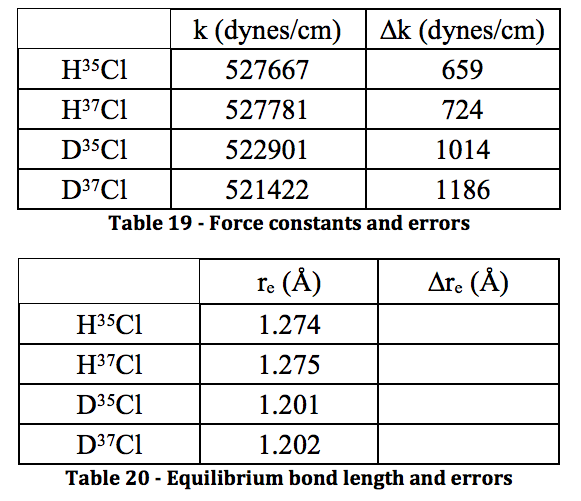
FTIR spectroscopy was used to analyze rotational-vibrational transitions in gas-state HCl and DCl and their isotopomers (due to 35Cl and 37Cl) to determine molecular characteristics. Energy transitions from the spectra were plotted vs. frequency, from which several physical constants were determined. These constants were then used to determine the force constants, H35Cl=527667(error) dynes/cm, H37Cl=527781(error) dynes/cm, D35Cl=522901(error) dynes/cm, and D37Cl=521422(error) dynes/cm; and equilibrium bond length, H35Cl=1.274(error)Å, H37Cl=1.275(error)Å, D35Cl=1.201(error)Å, D37Cl=1.202(error)Å.
Introduction & Theory
Fourier transform infrared spectroscopy (FTIR) is a form of spectroscopy used when high resolution spectroscopy is required. More simple spectrometers using prisms to diffract light do not have the resolving power necessary to separate the rotational effects in the vibrational regime of energy transitions. Because the rotational energy levels are much more closely spaced than the vibrational energy levels, ~20 cm^-1 vs. ~2900 cm^-1, respectively, simple dispersive IR spectroscopy is simply not viable.1 Thus, a higher resolving power is required. FTIR spectroscopy uses gratings for diffraction and then processes the raw data from an interferogram into the actual spectrum via the mathematical process known as a Fourier transform.
In this experiment, FTIR spectroscopy was used to analyze rotational-vibrational transitions in gas-state HCl and DCl and their isotopomers (due to 35Cl and 37Cl) to determine molecular characteristics. In essence, as the light from the source passes through the sample cell, the sample is energetically excited both rotationally and vibrationally. With sufficiently high resolving power, a vibration spectrum can be obtained that not only shows the vibration excitation, but also the rotation excitation within it. Figure one depicts this overlay of both rotational and vibrational energies:
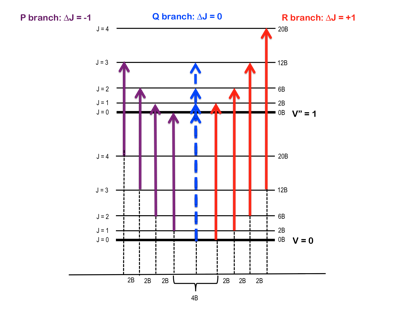
Figure 1 – Rotational energy levels, J, superimposed upon the vibrational energy levels, v, and the separation thereof into P & R branches.2
This change in vibrational energy (ν=0 to ν=1) with several different rotational energy changes (J=±1) leads to the splitting in a typical ro-vibrational spectrum shown in Figure 2.
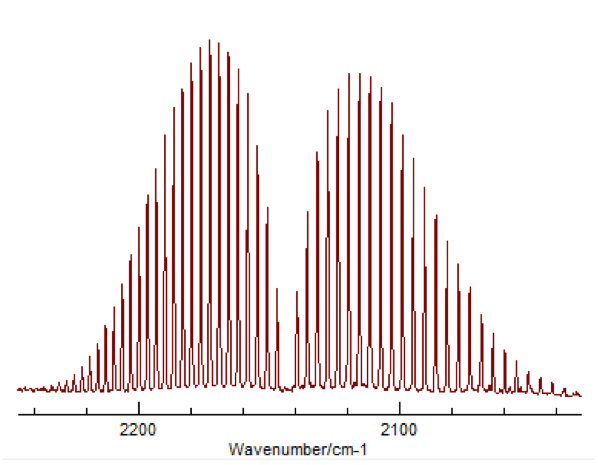
Figure 2 – Typical appearance of a ro-vibrational FTIR spectrum3
The peaks to the left correspond to what is called the “P-Branch,” where ΔJ = -1, and the peaks to the right correspond to the “R-Branch,” where ΔJ = +1. Once a spectrum like this was obtained for HCl and DCl, peak values were assigned to the P and R branches, for both 35Cl and 37Cl. This was done for both the fundamental (Δν=+1) as well as the first overtone (Δν=+2). The overtone’s appearance is due to the potential of the molecule being more similar to a Morse potential rather than a true harmonic oscillator. This difference allows a very small but significant amount of transitions where Δν=+2, despite that being against the typical “selection rules” for quantum mechanic systems.
The ability to extrapolate out from the spectral data into molecular information depends on some mathematical relations that begin with classical mechanics and are brought into the quantum mechanical field through some manipulation.
The Rigid Rotor
To describe the rotation of an object, the classical mechanics form would describe the energy as
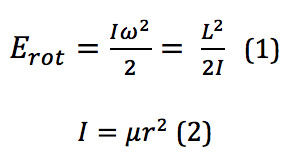
where I is the moment of inertia, ω is the angular velocity, and it is then put into terms of L, the angular momentum, μ, the reduced mass, and r, the bond length. However, because these rotational energy levels are not a continuum but rather discrete, quantized levels, a different definition must be used. This is given by the equation found by solving for eigenvalues of a rotational system Schrodinger equation. When derived, the energy for the Jth rotational state is found by
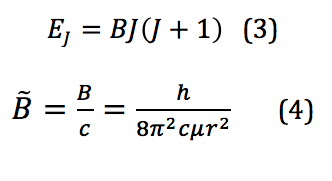
where B is called the rotational constant. This value, when reported in wavenumbers, cm-1, is then denoted by the added tilde – . However, because the system of interest isn’t in reality a perfect rigid rotor, there is also a factor that needs to be introduced that corrects for any centrifugal distortion. Centrifugal distortion occurs because as the molecule rotates, it also stretches. This correction is shown in equation 5:
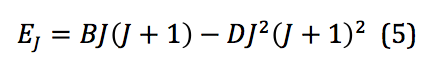
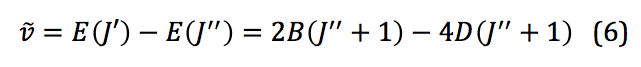
where D is the centrifugal distortion constant. Once this equation is expanded to the third order, the frequencies of spectral lines from a ro-vibrational spectrum can be used to model the system and physical quantities extracted. Those frequencies can be represented mathematically as shown below:
Harmonic Oscillator
To describe the vibrational motion of a diatomic molecule, the first place to start is a simple harmonic oscillator. This motion is described mathematically in equation 7:
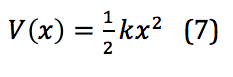
In this equation, k is the force constant and x is the distance between the two masses – in this case, between the two atoms of a diatomic, or the internuclear distance. When applied to the quantized levels of quantum mechanical concepts, the energy of the vibration is found via equation 8:
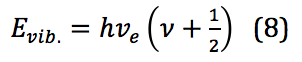
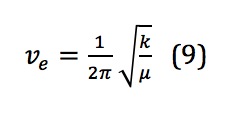
Where is Planck’s constant, νe is the harmonic frequency, and ν is the vibrational quantum number, with ν = 0,1,2,3, . . . νe is calculated as shown in equation 9:
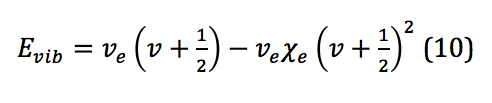
However, because, similar to the rigid rotor, the system described here is not a perfect harmonic oscillator, correction is required. Correction for anharmonicity that comes from the system more closely resembling a morse potential changes the energy levels of the vibrational states to
where is the anharmonicity constant, found by
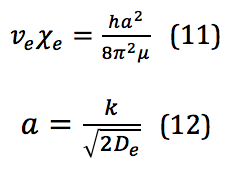
This is where the ability to bend the selection rules comes from, and the transition Δν=+2 is allowed; however, the likelihood of this happening is so small that the signal strength of this first overtone is significantly less than the fundamental.
The general equations for the fundamental and overtone excitations are given in the following equations:
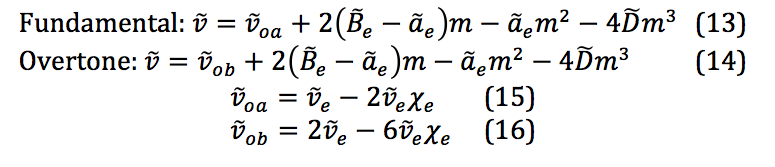
These are the key equations for extracting the molecular physical constants after fitting the data obtained from the spectra to the 3rd degree polynomial.
Experimental
A diagram depicting the manifold used for the production of the HCl and DCl gas is shown below in figure 3:
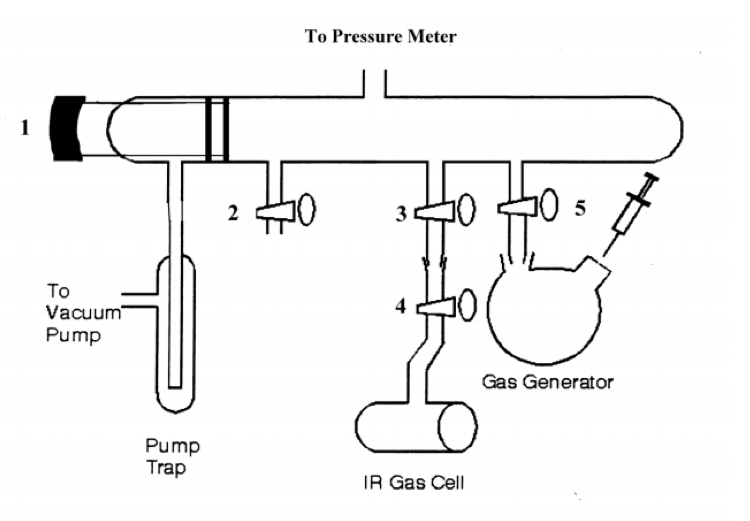
Figure 3 – Vacuum manifold for HCl/DCl experiment4
The manifold is relatively straightforward in use. Numbers 1-5 are stopcocks. The pump trap was a trap that a thermos filled with liquid nitrogen surrounded to condense any gas-phase HCl before it reached the vacuum pump. After closing all stopcocks, the pump was turned on, and stopcock one was opened to pump the system down in pressure to 1 torr. Stopcock 1 was closed, and the pressure slowly rose, indicating a leak. This was found to be at the junction from the gas generator to stopcock 5. This was repeatedly checked throughout the experiment to ensure proper sealing of the system. Once the leak was fixed, the system pumped, and the reading stayed steady at 1 torr, stopcocks 3 and 4 were opened to pump out the IR gas cell. Once this also reached 1 torr, stopcocks 3 and 4 were closed, and it was removed and used to create a background spectrum in the FTIR instrument. This background FTIR spectrum was collected at both 16 cm-1 and 1 cm-1 resolution. The IR cell was reconnected to the manifold, and the rest of the experiment began.
The main part of the experiment was divided into two halves – first, the production of HCl and the associated FTIR analysis, and then the production of DCl and its associated FTIR analysis.
Once the IR cell was reconnected, the first half the experiment began. ~1 gram of NaCl was added to the gas generator cell, and connected to the manifold. Stopcock 5 was slowly opened to pump out the round-bottomed-flask (RBF), after which stopcocks 3 and 4 were opened. Once the entire system was at 1 torr, and stopcock 1 was closed to check for leaks and a consistent vacuum was achieved, ~1 mL of H2SO4 was added through a septum on the RBF containing the sodium chloride. This reaction produced the HCl gas that flowed into the IR cell. Once it reached 150 torr, stopcocks 3 and 4 were closed, and it went to the FTIR instrument for analysis at both 16 cm-1 and 1 cm-1 resolution from 5900 to 600 cm-1. As this was being analyzed, stopcock 1 was slowly opened to pump out the HCl gas, the IR cell was reattached following analysis, it was also pumped out, and the RBF was removed and cleaned. This was repeated at an HCl pressure of 100 torr and 207 torr.
Once it was determined that ~100 tor and a resolution of 1 cm-1 were the best parameters for analysis, the process was repeated but only at 100 torr and 1 cm-1 resolution with deuterated sulfuric acid, D2SO4, for the production of DCl.
Data & Calculations
After running the experiment at different sample cell pressures and different resolutions, it was determined that the ideal parameters for the experiment were 100 torr pressure with a resolution of 1 cm-1. These are the graphs that will be included in this data section.
HCl Fundamental:
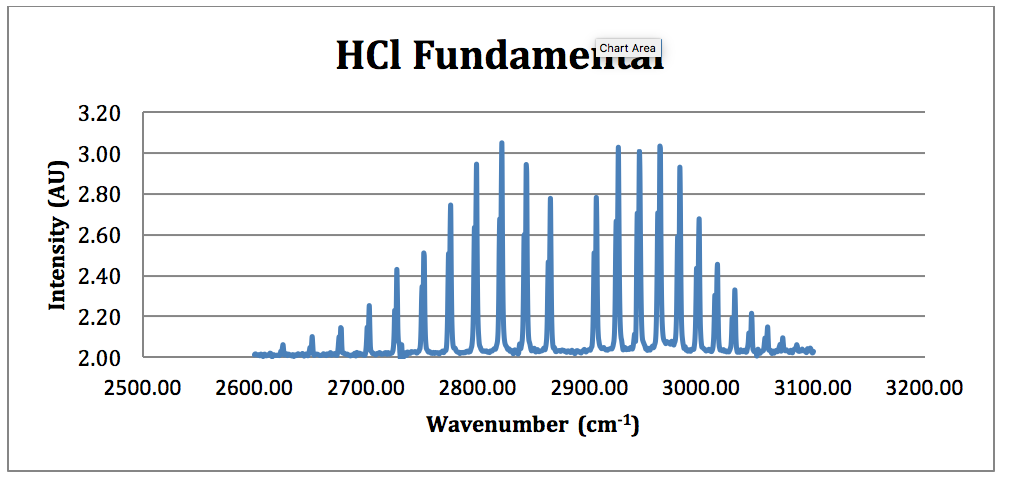
Figure 4 – HCl Fundamental FTIR Spectrum
*H35Cl Fundamental:
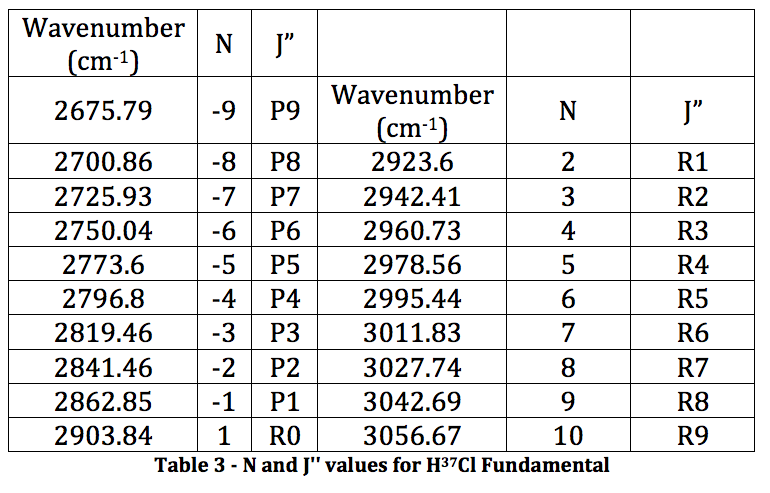
From this spectrum of the fundamental, each peak was assigned an N value for the H35Cl P & R branches. This is found in Table 1.
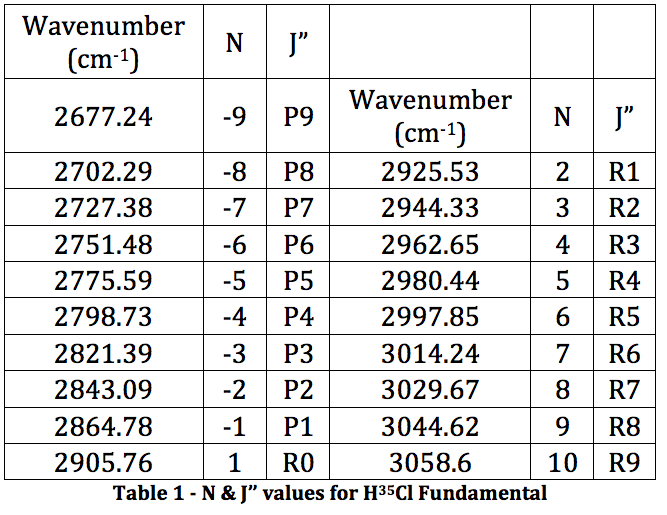
This was then plotted as ν (cm-1) vs. N and fitted to a 3rd order polynomial.
Graph 1 – Plot with Fit Line of H35Cl Fundamental
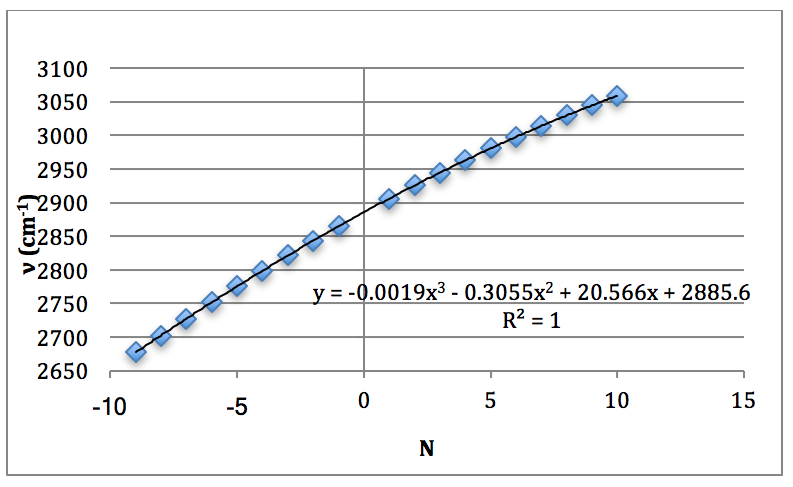
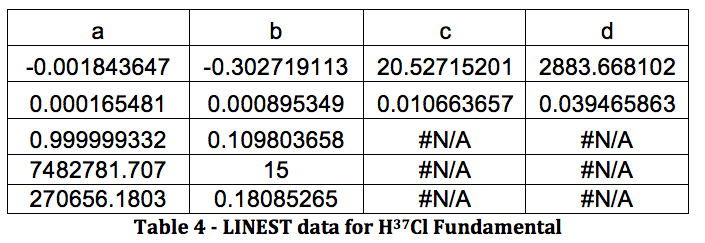
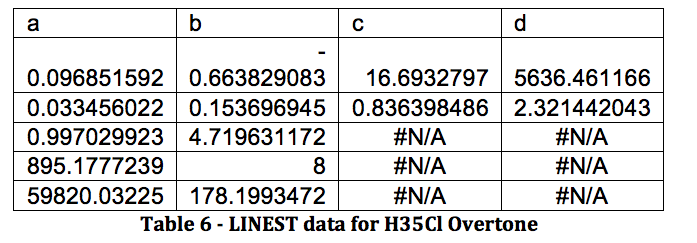
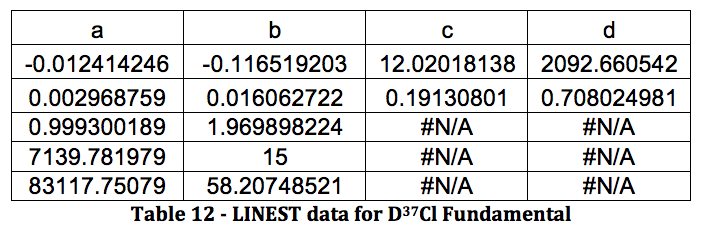
The results from LINEST are shown below:
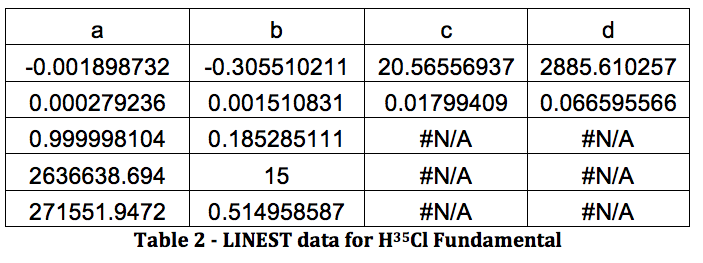
All of this will be repeated below for the rest of the data, in the following order: H37Cl Fundamental, H35Cl Overtone, H37Cl Overtone, D35Cl Fundamental, D37Cl Fundamental, D35Cl Overtone, D37Cl Overtone.
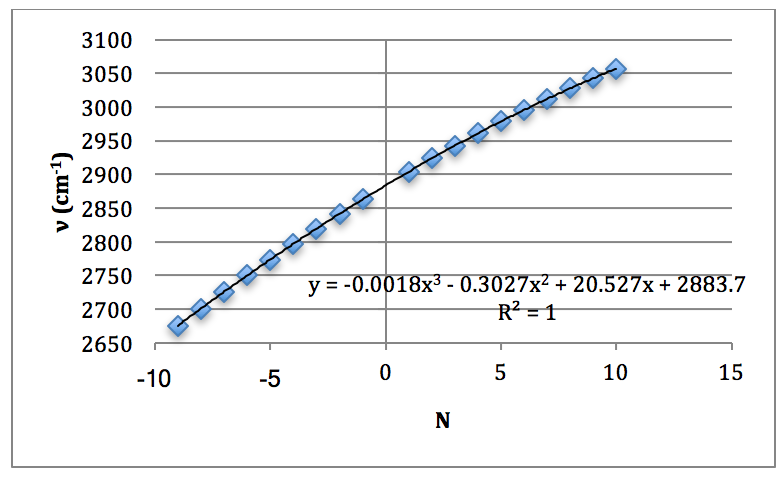
*H37Cl Fundamental:
Graph 2 – Plot with Fit Line of H37Cl Fundamental
HCl Overtone:
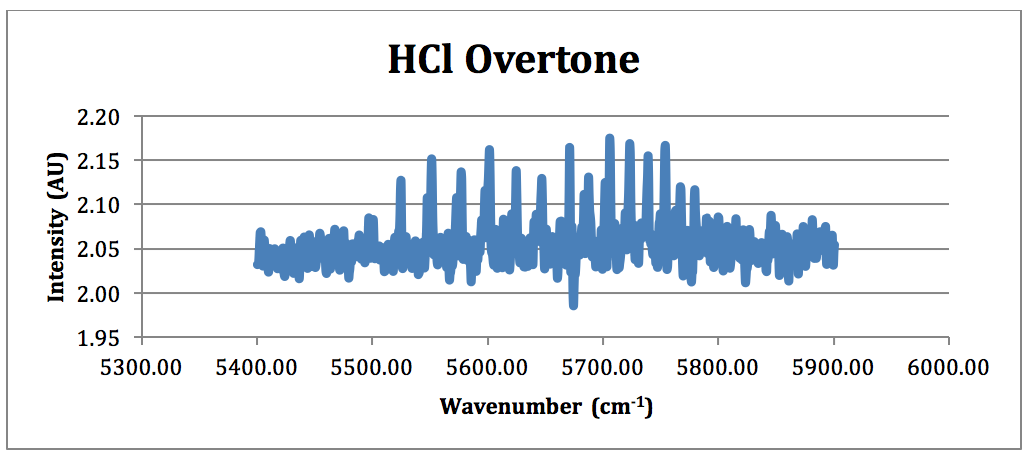
Figure 5 – HCl Overtone FTIR Spectrum (NOTE: because of the poor overtone in the 100 torr spectrum, the HCl overtone is taken from the run performed at 207 torr)
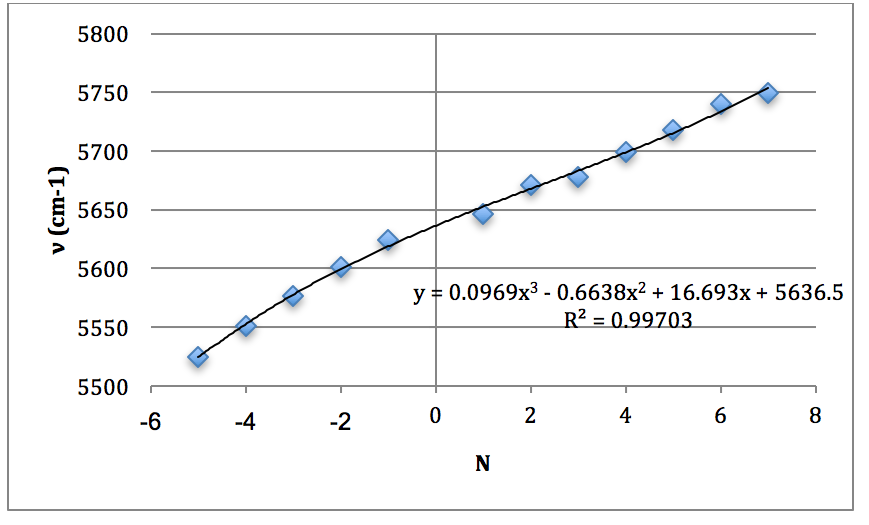
*H35Cl Overtone
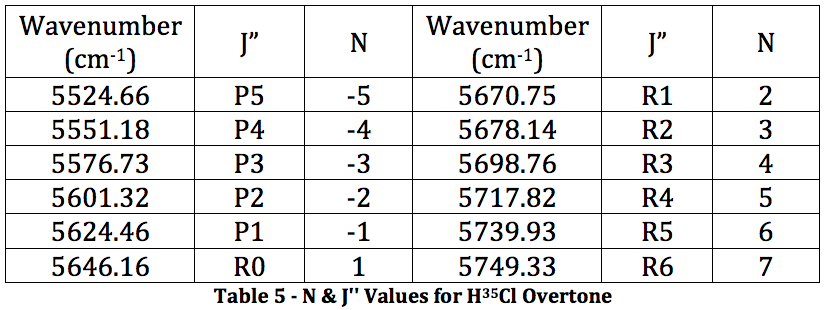
Graph 3 – Plot with Fit Line of H35Cl Overtone
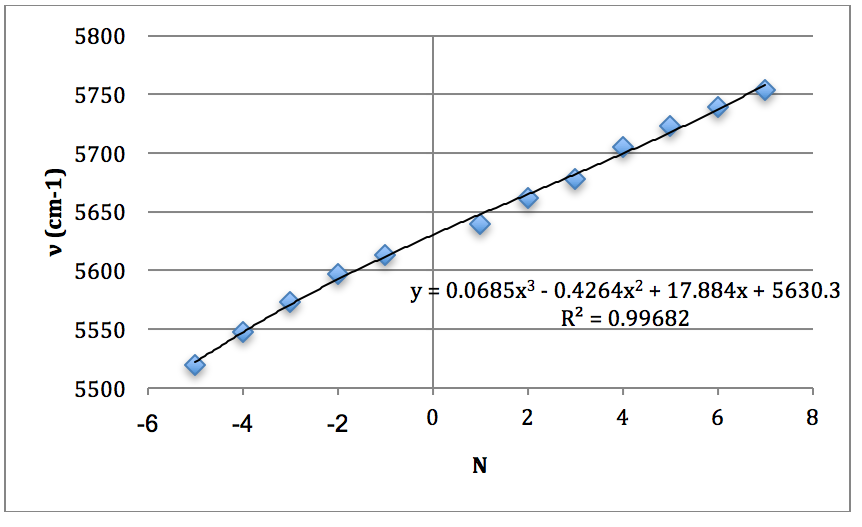
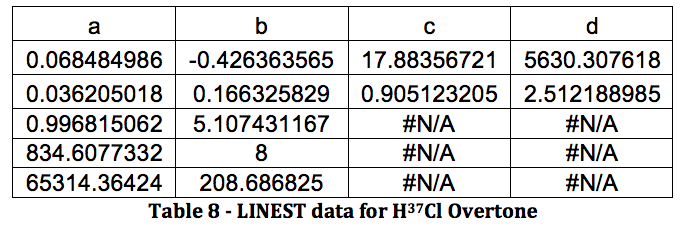
*H37Cl Overtone
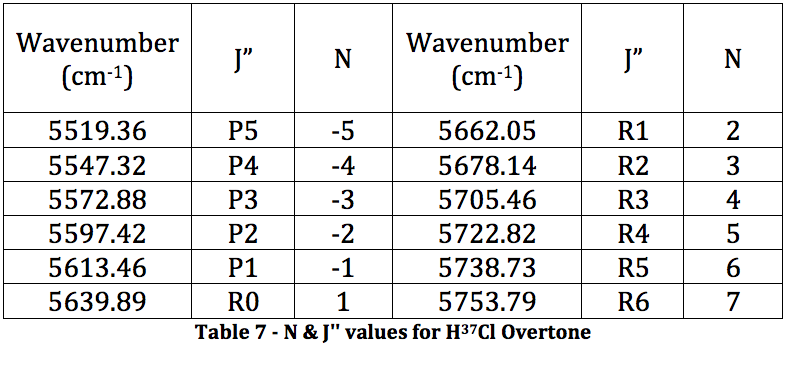
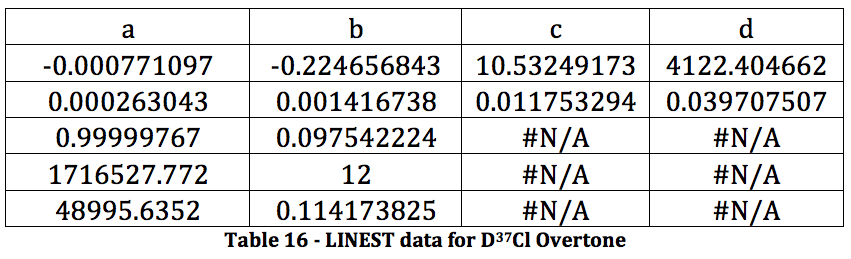
Graph 4 – Plot with Fit Line of H37Cl Overtone
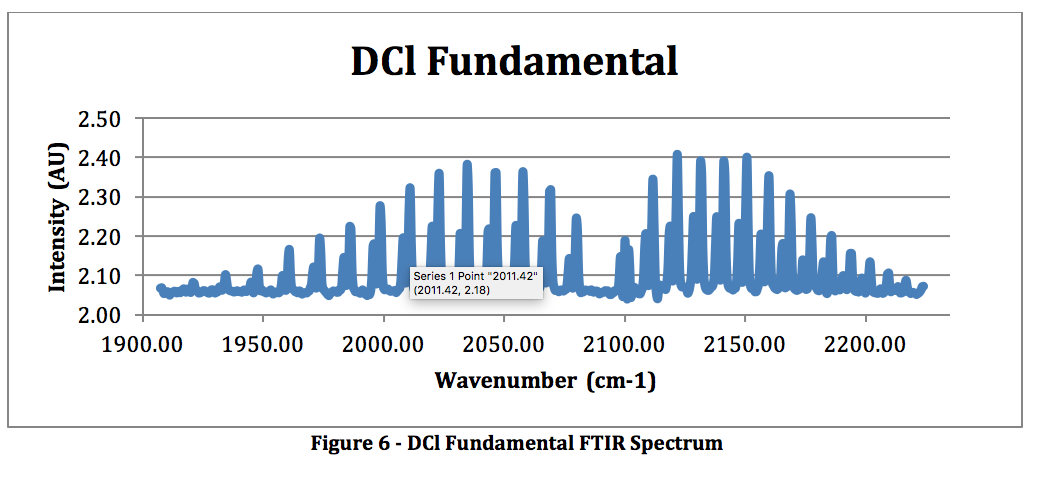
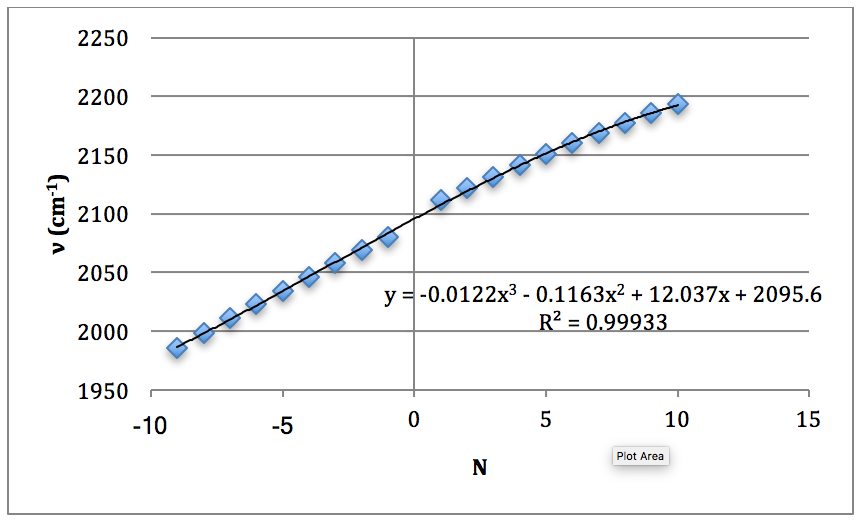
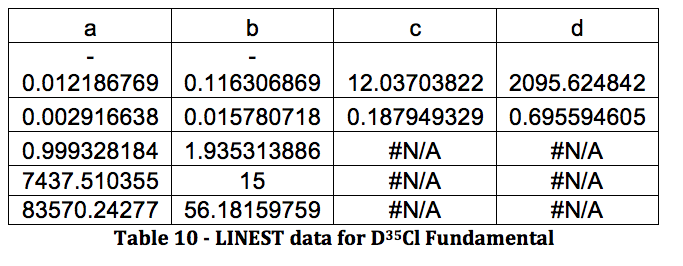
DCl Fundamental:
*D35Cl Fundamental
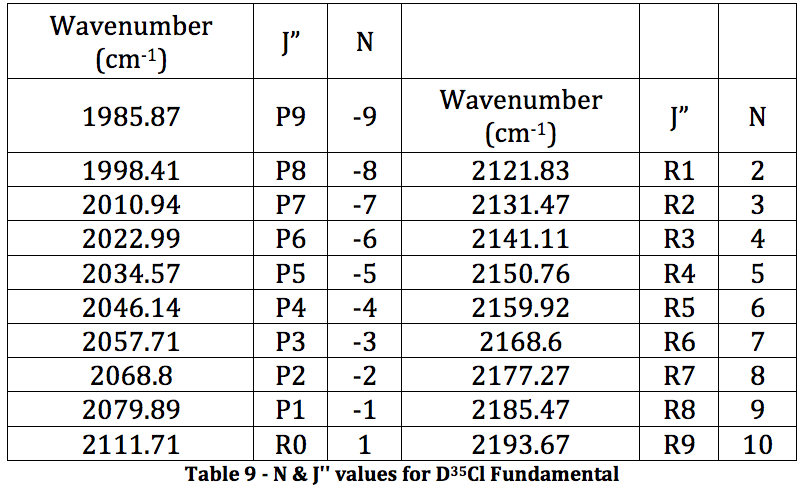
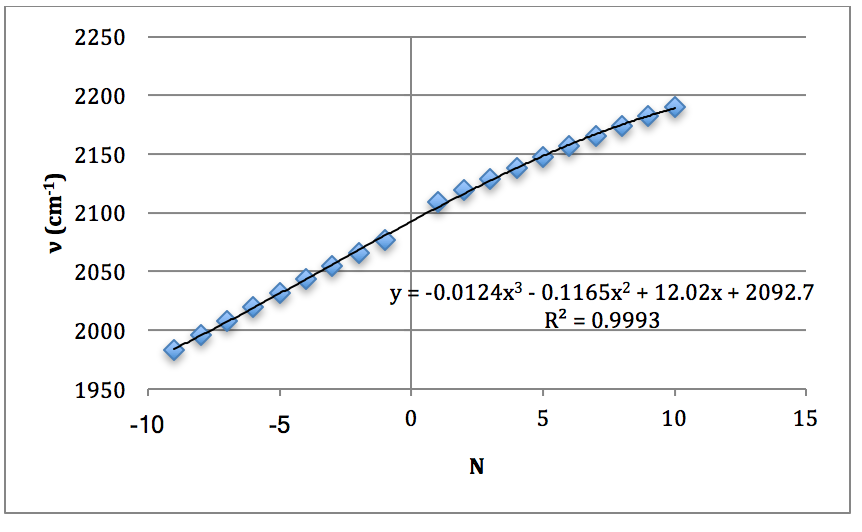
Graph 5 – Plot with Fit Line of D35Cl Fundamental
*D37Cl Fundamental
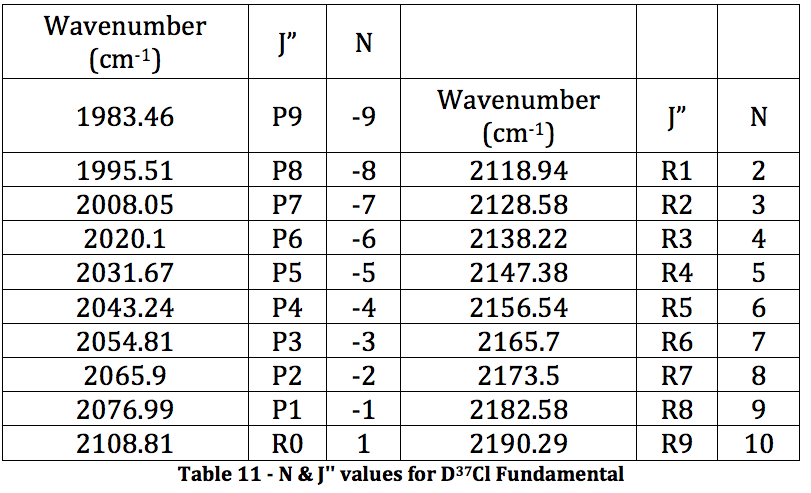
Graph 6 – Plot with Fit Line of D37Cl Fundamental
DCl Overtone:
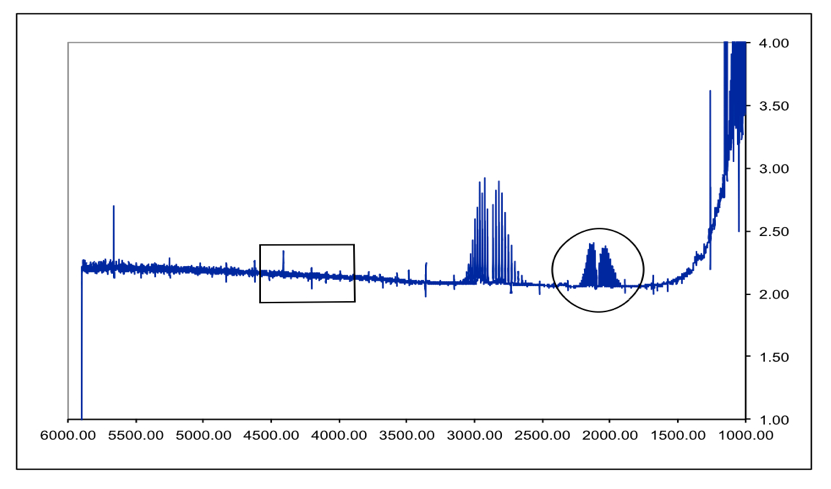
Figure 7 – DCl Full FTIR Spectrum. Fundamental is in the circle. Boxed area is where the overtone SHOULD be. Peaks between them are an HCl impurity. Due to the lack of an overtone in the spectrum, the following overtone data was received from the TA so the proper calculations could be performed.
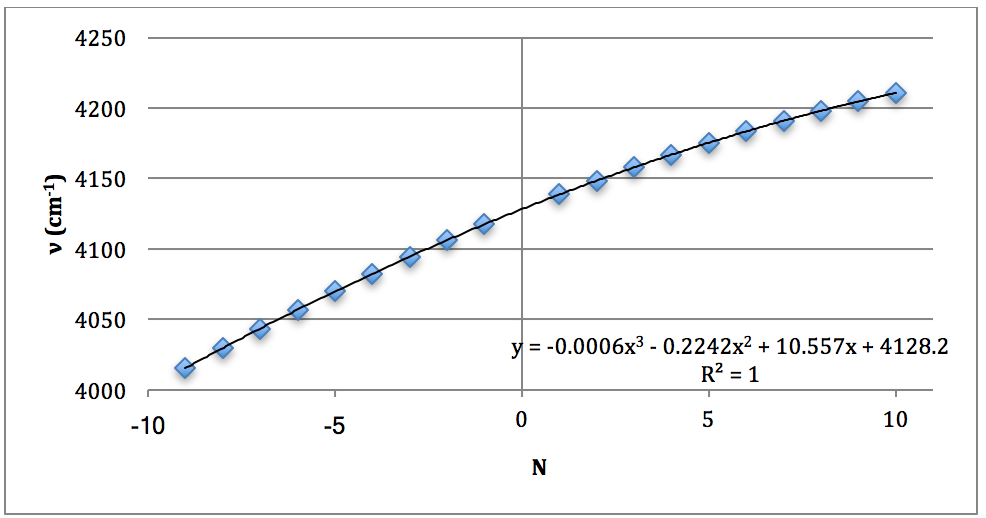
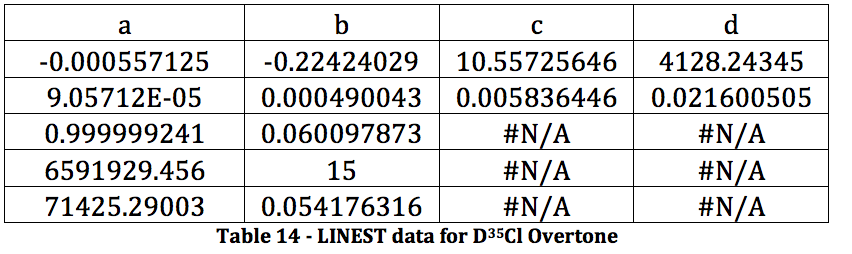
*D35Cl Overtone
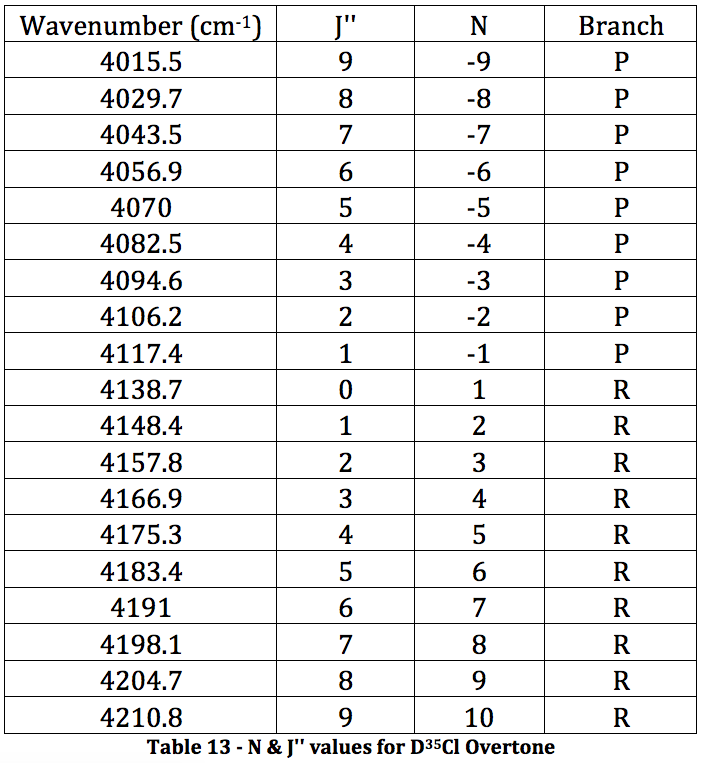
Graph 7 – Plot with Fit Line of D35Cl Overtone
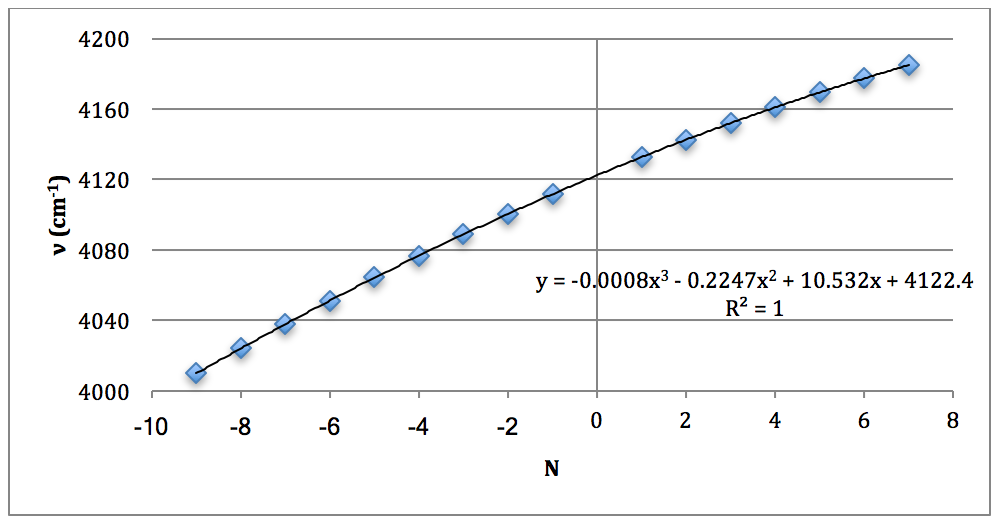
*D37Cl Overtone
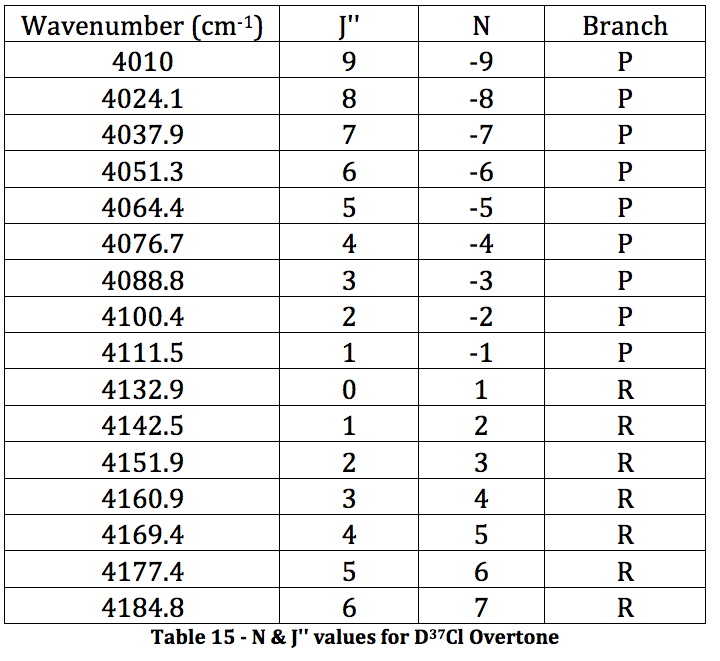
Graph 8 – Plot with Fit Line of D37Cl Overtone
CALCULATIONS
The properties of the diatomic molecules studied are found right in the LINEST data tables. By comparing the polynomials produced by the LINEST regression analysis with equations 13-16, it can be determined that:
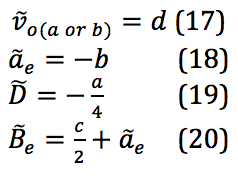
Table 17 was formed by this process.
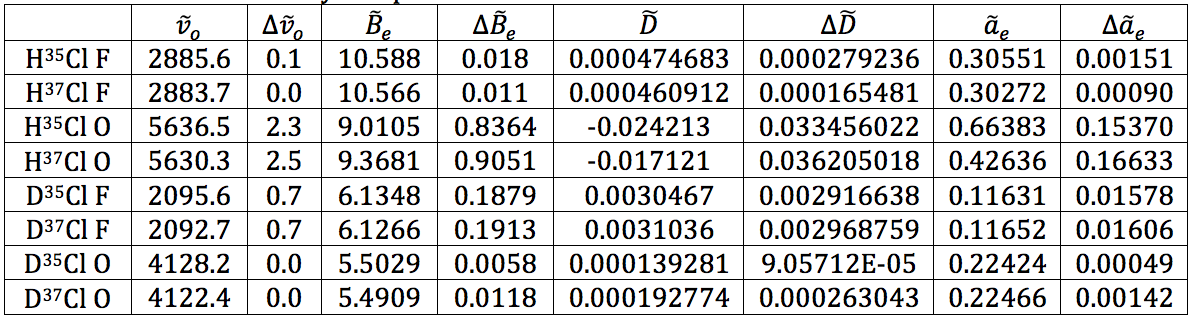
Table 17 – Physical constants determined via LINEST regression analysis
The rest of the calculations are on the attached sheets. The results thereof are as follows:
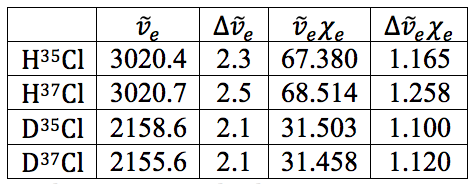
Table 18 – Natural Frequencies and Anharmonicity Constants with Errors
Discussion
*Further Thoughts and Questions
- To prevent gaseous hydrochloric acid from entering the pump system. Liquid nitrogen is used because it will condense gas phase HCl quicker and more efficiently than dry ice.
- The force constants are all relatively close together, whereas the equilibrium bond length is significantly different – when on the order of Angstroms, 0.07 Å is a lot. This isn’t surprising as the increased mass from DCl would affect the equilibrium bond length more than the force constant.
- At around 1600-1800 cm-1, because as the reduced mass increases the shift decreases. This is shown on our DCl spectrum with the HCl fundamental impurity showing up to the left of the DCl fundamental.
- You would have to shine the laser at a frequency that is so narrow only one of the isotopes absorbs whereas the other wouldn’t. The chlorine isotopes could be collected by a very high efficiency time of flight separator. I don’t think it would work, as the isotopes wouldn’t be separable – the instrumentation isn’t there yet.
Discussion of results:
The results shown throughout each of the stages of the experiment are believed to be a high quality due to the low errors found in each value. Unfortunately, the calculations for the error on bond length and force constant wouldn’t work out. No matter how many times I tried manipulating the variables and making sure units cancelled, I could not get the answer to be in the correct regime. This is very disappointing. However, the literature value for the bond length of HCl is 1.27455 angstroms in the CRC Handbook of Chemistry and Physics, and the calculated value for this was found to be 1.274 and 1.275 for the two isotopomers. With the caveat that a large error could make that value irrelevant, at least the calculation was accurate, despite the precision being unknown. For DCl, the literature value is 1.27458, whereas the calculated values were 1.201 and 1.202. This inaccurate calculation is most likely due to the severe HCl contamination in the DCl sample – the deuterated sulfuric acid was not as pure as the bottle reported, shown by the spectrum. Because of this impurity, the values could have not only been shifted, but they were simply harder to read from the spectrum. I believe that with a truly 99% deuterated sulfuric acid sample to perform the experiment, the values would be much more accurate.
As for the force constant, the literature value for HCl is 481000 dynes/cm. The calculated values for this were 527667, 527781, 522901, and 521422 dynes/cm. These values represent ~10% error. This value is actually relatively good for the instrument we were using and the sample purities given.
All in all, the earlier values calculated for the anharmonicity constant and natural frequency via the LINEST regressions all worked out well and the error propagation worked as well. It is believed that with the very small errors on these values that they are both accurate and precise.
Conclusion
The values for the anharmonicity constants and natural frequencies were found with high accuracy and precision, whereas the values for the equilibrium bond length and the force constant were accurate, but the precision is unknown. The experiment only had one significant source of error in the impurity of the sulfuric acid that was supposed to be deuterated. This is believed to be the main source of error in any of the DCl calculations. The other significant problem was that the overtone in the DCl spectrum didn’t appear. Using both personal spectrum values for the fundamental and TA values for the overtone could also have introduced more error as they were performed at separate times in potentially different environments. With instruments this sensitive, that can be a big problem.
References
- Halpern, Arthur M., and McBane, George Clyde. Experimental Physical Chemistry: A Laboratory Textbook. New York: W.H. Freeman, 2006. Experiment 36, Rotational-Vibrational Spectrum of HCl.
- Cooley, Joya. “Rovibrational Spectroscopy.” UCDavis – Chemwiki.
- Wikimedia commons – http://commons.wikimedia.org/wiki/File:Carbon_monoxide_rotational-vibrational_spectrum.png
- Figure 3 obtained from online lab manual pdf for this particular experiment, provided by the UofA chemistry department
