The Effect of Temperature on Voltage in a Galvanic Cell
The Effect of Temperature on Voltage in a Galvanic Cell
By: Kaitlyn Barr
Aim:
To investigate the extent to which temperature affects the voltage in a Daniell cell.
Variables
Independent Variable: The temperature (˚C) of the cell (0˚C, 3˚C, 15˚C, 22˚C and 34˚C) (measured with a temperature probe)
Dependent Variable: The voltage (V) that the cell produces (measured with a voltmeter)
Control Variables:
- Amount of metal used in cell (1.0g copper and 1.0g zinc). The amount of each of the metals will be measured by a gram scale.
- Concentration of solutions in cell 50 mL of copper sulphate (1.0 mol/liter) and 50 mL of zinc sulphate (1.0 mol/liter). For the molarity, the grams will be measured with a gram scale and the liters will be measured with a graduated cylinder.
- Salt bridge (potassium nitrate and filter paper). The filter paper will be saturated in 1.0 molar potassium nitrate for 30 seconds.
- The time that the voltage is measured (75 Seconds). This will be controlled by using a stop watch to time the measurements of the voltage.
- Pressure: this will be controlled because it will be atmospheric pressure that the cell is exposed to.
Materials
For Daniell Cell:
Safety goggles
Gram scale
Graduated cylinder
Filter paper
50 mL-1.0M solution of potassium nitrate
Distilled water
2-100 mL beakers
1-Copper strip (1.0g)
1-Zinc strip (1.0g)
50mL-1.0M solution of copper sulphate 50mL-1.0M solution of zinc Nitrate
For Voltage Measurement:
Safety goggles
Voltmeter
Temperature probe
Temperature bath
Refrigerator
Distilled water
Stop watch
Procedure
- Safety goggles were worn throughout the experiment to ensure the safety of the individual.
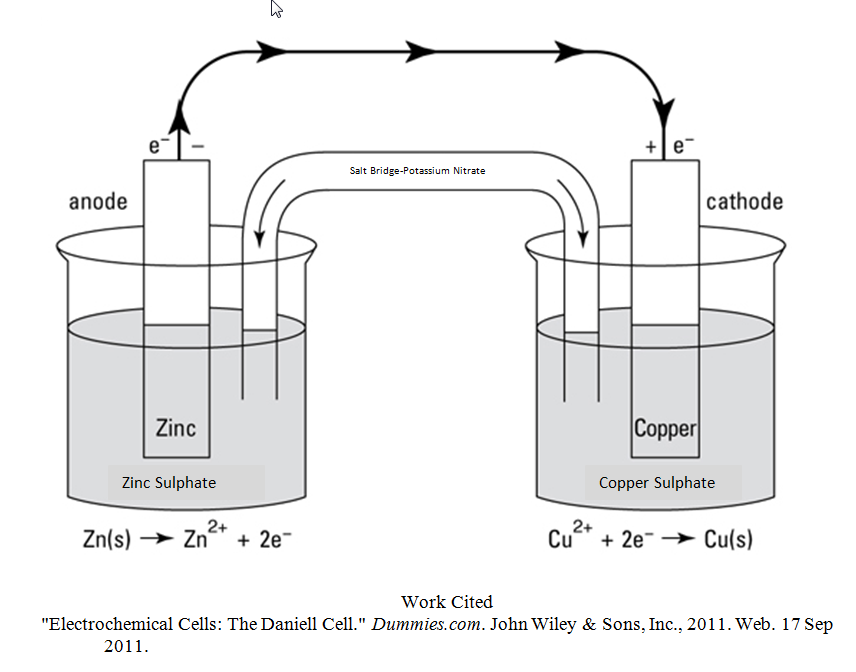
- A Daniell Cell was constructed such that in Figure 1.
- The cell was placed in an ice bath for an hour so that the temperature of the cell was approximately 0˚C. The temperature was measured by a temperature probe and recorded.
- The cell was connected to the voltmeter and the voltage of the cell was measured at 75 seconds.
- The cell was disconnected from the voltmeter.
- Steps 3-5 were repeated four more times, making 5 trials at 0˚C.
- The Daniell cell was then put in a temperature bath of 3˚C for an hour so that the temperature was approximately 3˚C. The temperature was measured by a temperature probe and recorded.
- The cell was connected to the voltmeter and the voltage of the cell was measured at 75 seconds.
- The cell was disconnected from the voltmeter.
- Steps 7-9 were repeated four more times, making 5 trials at 3˚C.
- The Daniell cell was put in a temperature bath of 15˚C for an hour so that the temperature of the cell was approximately 15˚C. The temperature was measured by a temperature probe and recorded.
- The cell was connected to the voltmeter and the voltage of the cell was measured at 75 seconds.
- The cell was disconnected from the voltmeter.
- Steps 11-13 were repeated four more times, making 5 trials at 15˚C.
- The Daniell cell was put in a temperature bath of 22˚C for an hour so that the temperature was approximately 22˚C. The temperature was measured by a temperature probe and recorded.
- The cell was connected to the voltmeter and the voltage of the cell was measured at 75 seconds.
- The cell was disconnected from the voltmeter.
- Steps 7-9 were repeated four more times, making 5 trials at 22˚C.
- The cell was put in the refrigerator at 34˚C for an hour so that the temperature of the cell was approximately 34˚C. The temperature was measured by a temperature probe and recorded.
- The cell was connected to the voltmeter and the voltage of the cell was measured at 75 seconds.
- The cell was disconnected from the voltmeter.
- Steps 19-21 were repeated four more times, making 5 trials at 34˚C.
Figure 1:
|
|
|
Work Cited
“Electrochemical Cells: The Daniell Cell.” Dummies.com. John Wiley & Sons, Inc., 2011. Web. 17 Sep 2011.
Data Collection and Processing
Raw Data
|
Differences in Temperature |
|||||
|
Temperature of Cell |
Trial 1 Voltage Reading (V) (±0.01) |
Trial 2 Voltage Reading (V) (±0.01) |
Trial 3 Voltage Reading (V) (±0.01) |
Trial 4 Voltage Reading (V) (±0.01) |
Trial 5 Voltage Reading (V) (±0.01) |
|
0°C (±1) |
0.91 |
0.90 |
0.91 |
0.87 |
0.89 |
|
3°C (±1) |
0.91 |
0.94 |
0.90 |
0.95 |
0.93 |
|
15°C (±1) |
0.83 |
0.85 |
0.86 |
0.83 |
0.86 |
|
22°C (±1) |
0.84 |
0.85 |
0.82 |
0.86 |
0.85 |
|
34°C (±1) |
0.85 |
0.82 |
0.78 |
0.85 |
0.84 |
While observing the Daniell Cell at different temperatures, there was little change in the cell. The most notable thing that was observed was the difference between the copper sulphate solution at 0°C and 34°C. At 0°C, the copper sulphate solution and the zinc nitrate solution were each a mixture between liquid and ice, and the copper sulphate solution was a light blue color. At 34°C, the copper sulphate solution was fully liquid and a dark blue color. For the three middle temperatures, 3°C, 15°C, and 22°C, the copper sulphate solution was a uniform blue color. The color of the zinc nitrate solution did not change, and after 0°C, the solution was fully a liquid.
Data Processing
Overview
Because this lab was to determine the extent to which temperature affects the voltage in a Daniell Cell, the average and standard deviation was used to evaluate the data. The average of each of the temperatures was taken at the end of the five trials. The standard deviation was used to demonstrate the variability and reliability of the data.
Sample Calculation
0°C Measurements: 0.91; 0.90; 0.91; 0.87; 0.89
Average: Sum of all data points/Number of data points.
Average: (0.91 + 0.90 + 0.91 + 0.87 + 0.89)/5
Average: 4.48/5
Average: 0.90 (s) (±0.01)
Presentation
|
Differences in Temperature |
|||||||
|
Temperature of Cell |
Trial 1 Voltage Reading (V) (±0.01) |
Trial 2 Voltage Reading (V) (±0.01) |
Trial 3 Voltage Reading (V) (±0.01) |
Trial 4 Voltage Reading (V) (±0.01) |
Trial 5 Voltage Reading (V) (±0.01) |
Average Voltage Reading (V) (±0.01) |
Standard Deviation of Voltage Reading (V) |
|
0°C (±1) |
0.91 |
0.90 |
0.91 |
0.87 |
0.89 |
0.90 |
0.0150 |
|
3°C (±1) |
0.91 |
0.94 |
0.90 |
0.95 |
0.93 |
0.93 |
0.0185 |
|
15°C (±1) |
0.83 |
0.85 |
0.86 |
0.83 |
0.86 |
0.85 |
0.0136 |
|
22°C (±1) |
0.84 |
0.85 |
0.82 |
0.86 |
0.85 |
0.84 |
0.0136 |
|
34°C (±1) |
0.85 |
0.82 |
0.78 |
0.85 |
0.84 |
0.83 |
0.0264 |
*There is an area of uncertainty within the temperature of the cell because of random error.
**There is an area of uncertainty within the voltage reading because of systematic error.
Conclusion and Evaluation
Conclusion
As the data shows, at the temperature of 3°C, the galvanic cell had the highest voltage reading with an average of 0.93 volts. The least efficient galvanic cell was seen at the temperature of 34°C with an average of 0.83 volts. From 3°C and higher, the voltage of the galvanic cell decreased from 0.93 volts to 0.84 volts. This shows that the most efficient galvanic cell would work at low temperatures, at about 3°C. All of the standard deviations within the collected data are within 0.0264 of 0, showing that the collected data is reliable.
Limits of Experimental Design
In the experimental design, things that worked well included the number of trials for each temperature. This would make the data of voltages more accurate as there were a number of trials. All of the data collected was precise because all of the trials were very close in results. Things that did not work well were when getting the cell to the right temperature for the specific temperature trial. It was difficult to keep the cell at a constant temperature for the amount of time of the trial. This could have affected the accuracy of the results as the temperature changed. There is a systematic error because the temperature baths that were used may not have all been calibrated to the exact correct temperatures. This could cause the data to be inaccurate. A random error that could possibly be seen within the experiment would be that the voltage of the cell may not have been taken at exactly 75s. This could cause the voltage reading to be less accurate.
Suggestions for Improvement
Suggestions for improvement for this experiment would include placing the cell in a temperature bath at the right temperature for the entire trial. This, along with having someone else time the cell and someone else take the voltage of the cell at exactly 75s would enable the collected data to be more accurate by reducing random error. Calibrating all of the temperature baths to the right scale, would reduce the systematic error within the experiment.
