Thermodynamics and Equilibrium Experiment
Thermodynamics and Equilibrium
By: Omish Samaroo
Introduction
The goal of this experiment is to determine the value of an equilibrium constant at different temperatures and use these data to calculate the enthalpy and entropy of reaction. The value of an equilibrium constant for a reaction varies, depending on the temperature. In endothermic reactions, the value of K increases as the temperature increases because heat can be thought of as a reactant. In exothermic reactions, and the value of K decreases as temperature increases because heat can be thought of as a product. Equation (1) describes the relationship between standard free-energy change, temperature, enthalpy and entropy of reaction, and the equilibrium constant, where the ideal gas constant R= 8.314 J/mol·K.
∆G° = -RT lnK = ∆H° – T∆S° Equation (1)
If we assume that ∆H° is temperature-independent over different temperatures, it follows that ∆S° will also be temperature-independent. With this assumption, Equation (1) can be rearranged to give Equation (2), which is in the form of a straight line. If we were to plot ln K vs 1/T(K) and determine a line of best fit, the slope of the line would be -∆H°/R and the y-intercept would be ∆S°/R.
ln K = -∆H°/R(1/T) + (∆S°/R) Equation (2)
In this experiment, we studied the solubility equilibrium of sodium tetraborate dodecahydrate (commonly known as borax). The equilibrium reaction is shown below.
Na2[B4O5(OH)4] . 8 H2O (s) « 2 Na+ (aq) + B4O5(OH)42- (aq) + 8 H2O (l) Equation (3)
The equilibrium constant for Equation (3) is the same as the solubility constant, Ksp, for borax in water. In this reaction, we determined the value of Ksp at five different temperatures. Then, after calculating ln(Ksp), making a scatter plot of ln(Ksp) vs. 1/T(K), and then determining a line of best fit in the form of Equation (2), we can determine the values of the enthalpy and entropy of reaction. To determine the value of Ksp, we first have to determine the concentration of the tetraborate ion in the equilibrated mixture. Because this ion is a base, its concentration can be determined by titrating with a standardized solution of HCl, as shown in Equation (4).
B4O5(OH)42- (aq) + 3 H2O (l) + 2 H+ (aq) > 4 H3BO3 (aq) Equation (4)
From the titration data, we can determine the concentration of the tetraborate ion in the equilibrated aliquot. The concentration of the sodium ion will be twice this value. From this information, we can calculate the value of Ksp, using Equation (5).
Ksp = [B4O5(OH)42-][Na+]2 Equation (5)
Procedure
A 600-mL beaker was filled with 300 mL of distilled water. The beaker was placed on a hot plate and a thermometer was clamped to a ring stand and placed in the beaker. The water heated to 95º C. (The beaker was kept at this temperature throughout the entire experiment.) To a 250-mL beaker was sequentially added exactly 40.0288 g of borax and 100 mL of distilled water. This beaker was then placed on a hot plate and another thermometer was clamped to a ring stand and placed in the beaker. The solution was heated to 65º C. As the solution was being heated, a 50-mL buret was conditioned and then filled with 50 mL of 0.5065 M HCl. The beaker was then removed from the hot plate. Then, exactly 5.007 g of borax was added to the beaker because there were no particles at the bottom of the beaker after the solution reached 65º C. The solution was then left to cool down. When the temperature reached 47º C, a 10-mL pipet was filled with hot water from the 600-mL beaker and then drained into the sink. Then, when the temperature of the solution reached 46º C, to a 250-mL Erlenmeyer flask was sequentially added a 10 mL aliquot of solution without pipetting any undissolved solid at the bottom of the beaker, 10 mL of hot water from the 600-mL beaker using the same pipet to make sure all of the solution escaped the pipet, and 30 mL of distilled water using a graduated cylinder. Then, 10 drops of bromocresol green was added to the flask and the flask was stirred. The solution was then titrated with the 0.5065 M HCl until the solution turned from blue to yellow. The final buret reading was recorded and then the buret was re-filled with the 0.5065 M HCl. This process of heating the pipet with hot water, draining it in the sink, taking 10 mL aliquots of borax solution, chasing with 10 mL of hot water, adding 30 mL of distilled water, adding 10 drops of bromocresol green, and titrating with 0.5065 M HCl until the solution turned from blue to yellow, recording the final buret reading and re-filling the buret with 0.5065 M HCl was repeated as the solution cooled down to 41º, 36º, 31º, and 26º C. Then, using the molality of the HCl and the stoichiometry associated with Equation (4), the concentrations of the tetraborate ion and the sodium ion were calculated and then the Ksp values were calculated at each temperature. Then, using Microsoft Excel, a plot of ln(Ksp) vs. 1/T(K) was made and a line of best fit was determined. Next, using the LINEST function, the values of -∆H°/R and ∆S°/R were determined. Finally, ∆H° and ∆S° of solution were calculated.
Results
Table 1: The volume of HCl added, the concentration of [B4O5(OH)42-], the values of Ksp and the value of ln(Ksp) at the different temperatures.
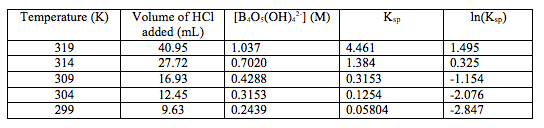
Figure 1: The graph of ln(Ksp) vs. 1/T(K), the line of best fit associated with the data, the equation for the line of best fit, and the value of the coefficient of regression, r2.
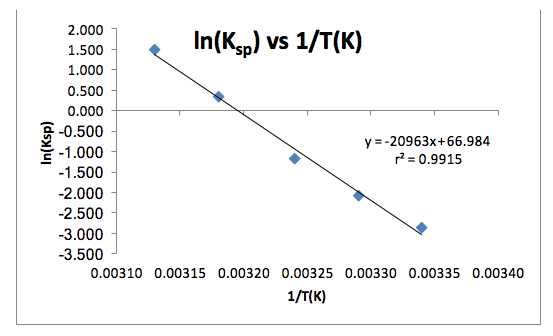
Table 2: The determined values from the line of best fit of the slope (-ΔHº/R), the intercept (ΔSº/R), the uncertainties of those values, and the calculated values of ΔHº and ΔSº.
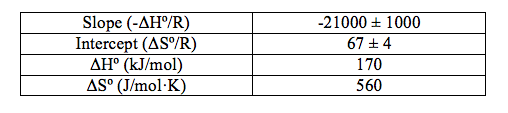
The data shows a clear trend that as the temperature decreases, the concentration of the tetraborate ion decreases, which follows that the value of Ksp decreases as temperature decreases (Table 1), which thus follows that the value of ln(Ksp) decreases as temperature decreases (Table 1 and Figure 1). The value of the coefficient of regression, r2 (Figure 1), is also shown. This value means that the changes in 1/T(K) explains 99.15% of the variations in ln(Ksp). This is good because it shows that there are not any influential points that can drastically change the line of best fit, which could also drastically change the values of the slope and the intercept. The determined line of best fit for the graph of ln(Ksp) vs. 1/T(K) is in the form of y=mx+b (Figure 1). This can be translated to Equation (2), where y=ln(Ksp), m=-ΔHº/R, x=1/T(K), and b=ΔSº/R. From this, the values of ΔHº and ΔSº were calculated (Table 2).
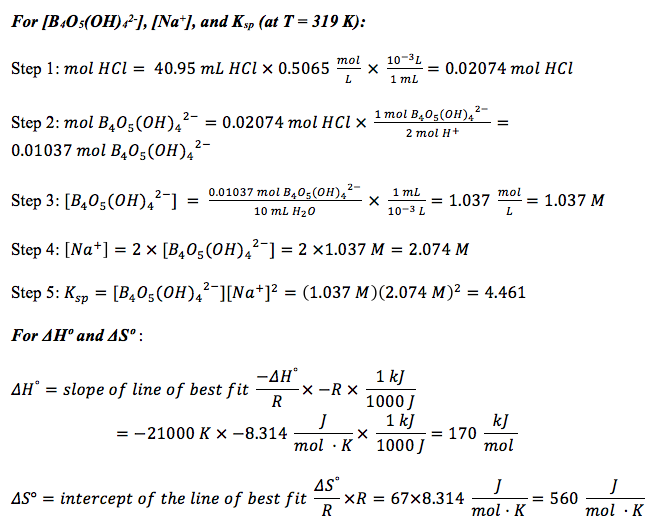
Sample Calculations
Discussion
The results show the trend that as temperature decreases, the value of the equilibrium constant also decreases. This satisfies the first goal of this experiment in studying the temperature-dependence of the equilibrium constant. The second goal of this experiment was to determine the values of the enthalpy and entropy of dissolution, which are 170 kJ/mol and 560 J/mol·K, respectively. The literature values of the enthalpy and entropy of dissolution of borax in water are 110 kJ/mol and 380 J/mol·K, respectively1. The percent errors in these values are 55% and 47%, respectively. These errors potentially resulted from the addition of extra borax after the solution was heated to 65º C. However, although there is a significant experimental error in the values of enthalpy and entropy of dissolution, the data is consistent. As shown through Figure 1, the coefficient of regression is considerably close to a value of 1, which means that there are not any influential data points or outliers that would significantly change the slope and intercept of the line of best fit if any of the points were removed from the plot. The signs of the enthalpy and entropy of dissolution are both positive. It makes sense that the ΔHº of solution is positive, meaning that the reaction is endothermic, because the mixture was heated and therefore the molecules needed to absorb the heat in order to turn into a solution. This also helps to understand why the sign of ΔSº is positive. When the signs of both ΔHº and ΔSº are positive, the reaction will be spontaneous at high temperatures (i.e. ΔGº < 0). This holds true for this reaction because the solution was heated to 65º C (338 K). Therefore, if we substitute these values into Equation (1), we find that the sign of ΔGº is in fact less than 0, meaning that the reaction is spontaneous at 338 K (ΔGº = -19000 J/mol < 0). Again, this makes sense because if the borax salt in water mixture was not heated, the reaction would not have taken place. Furthermore, as the temperature decreased during the experiment, some of the borax began to come out of solution. Therefore, it was expected that both the enthalpy and entropy of dissolution values would be positive for this reaction.
References
1 University of California Irvine Department of Chemistry. Enthalpy and Entropy of a Borax Solution. http://faculty.sites.uci.edu/chem1l/files/2011/03/E06MANborax.pdf (Accessed March 2, 2014)
