Thin Layer and Column Chromatography
Written by Nicolas
Introduction
In chemistry, the separation of a mixture of various compounds into separate compounds is an invaluable tool. Often times a reaction may produce an unwanted product in addition to the desired product, or one component of a mixture may need to be removed after a reaction is completed to analyze the reaction products. Out of all methods to separate compounds, Thin Layer Chromatography (TLC) and Column Chromatography are some of most effective. TLC is typically used for identifying the number of compounds in a mixture as well as their relative polarities as opposed to physically separating them, which can be accomplished with Column Chromatography. Both are used to separate compounds that are relatively non-volatile.
Procedure and Observations
In the first portion of the experiment, TLC was used to separate compounds. Seven different solvent mixtures were compared in order to evaluate which mixture was most effective as an elution solvent in separating four unknown compounds. The seven mixtures are as follows:
1.) Pure hexane
2.) 5 ml hexane : .5 ml ethyl acetate
3.) 4 ml hexane : 1 ml ethyl acetate
4.) 3 ml hexane : 2 ml ethyl acetate
5.) Pure ethyl acetate
6.) Pure diethyl ether
7.) Pure dichloromethane
Each mixture was prepared and placed in separate marked 150 ml beakers. A silica gel TLC plate served as the stationary phase while the solvent mixture served as the mobile phase during the TLC separation. A capillary tube was created by stretching out a glass tube in a Bunsen burner flame until it formed an extremely thin, hollow tube. This capillary tube was used to deposit a dot of the sample to be evaluated onto the TLC plate. The dot was measured so that it had a diameter of approximately 2-2.5 mm. After the plate was spotted with a small amount of the unknown, a line was drawn on the plate in pencil where the solvent level would be once the plate was placed into the beaker containing the solvent mixture. Seven plates were spotted and each was placed into one of the seven different solvent mixture chambers. Each beaker was covered with a watch glass to prevent any evaporation of solvent.
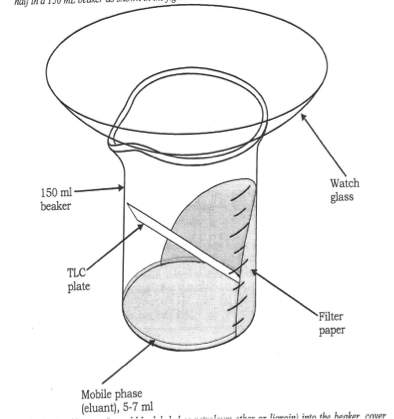
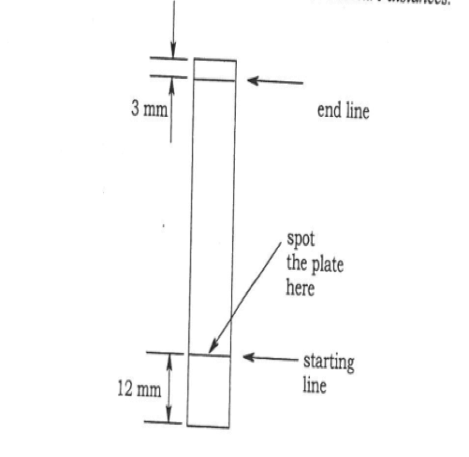
After the plate had been eluted and solvent had traveled near to the top of the plate, the plate was removed and the level to which the solvent traveled was marked with a pencil. Any spots of color immediately visible on the plate were marked with a pencil-drawn circle. To check for the presence of additional spots not visible under normal light, the plate was placed under a 254nm light and any additional spots were circled in pencil. Rf values were measured for each spot on the plate. (Figure 1)
Rf = Distance Spot Travels/ Distance Solvent Travels
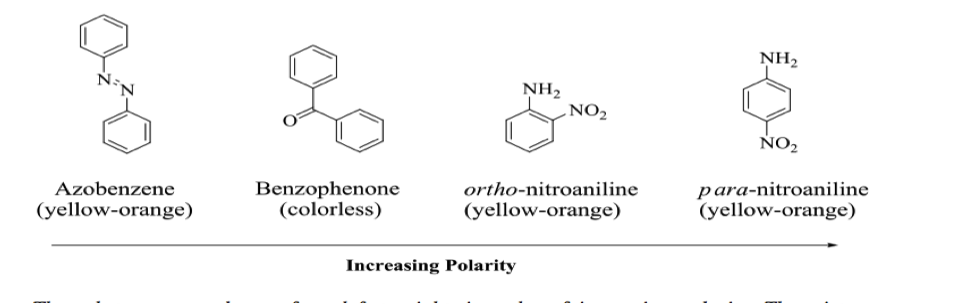
The Rf value provides a quantitative method for measuring how effectively compounds are separated. The most effective solvent mixture will have all four spots present on its respective plate, with the largest range of Rf values. In a TLC separation, the compounds of greatest polarity present are attracted most to the polar silica gel on the TLC plate, giving them the smallest Rf values, while the least polar compounds in a mixture have the largest Rf values. This is due to a tendency of the more polar compounds to resist transport by the eluant and remain attracted to the silica gel The possible unknown compounds for this TLC separation and their relative polarities are as follows:
In the next portion of the experiment, column chromatography was used to separate an unknown mixture. To prepare the sample, 2 ml of the unknown mixture was combined with ~0.5g of silica gel, and the solvent was evaporated over a week. After the solvent was removed, the unknown appeared as a dry orange powder. Next, the microscale column apparatus was assembled.
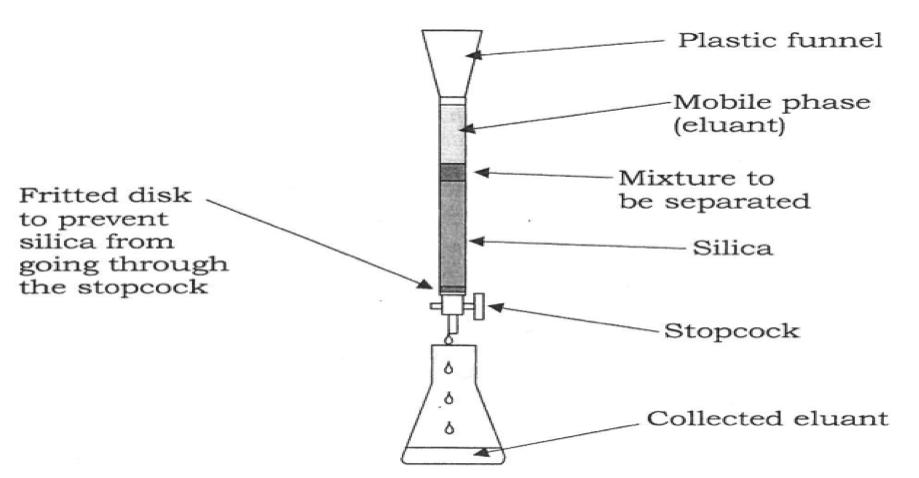
The fritted disk was inspected to ensure that no silica gel would escape during the separation and the stopcock was checked to ensure proper functionality. In this separation, a mixture of 30ml Petroleum ether and 1.5 ml ethyl acetate was used as the mobile phase. This mixture was prepared and placed in a 50 ml beaker. 1 ml of the eluant was placed into the column with the stopcock closed. 2g of silica gel was weighed out and then quickly mixed with 5 ml of petroleum ether/ethyl acetate mixture in a 10 ml Erlenmeyer flask and poured as a slurry into the column. 1 ml of eluant was mixed with the residual silica gel in the flask and poured into the column. The level of solvent above the silica was maintained around 35 mm in order to prevent the column from running dry and cracking. Additionally, bubbles were removed from the column by gently tapping it with a rubber stopper. After the silica gel column was free of bubbles, the orange powdered unknown was poured into the column and a small amount of eluant was poured down the funnel to wash excess powder stuck to the funnel into the column. Two empty 50 ml beakers labeled “beaker #1” and “beaker #2” were used to collect the two separations from the column. The mass of each beaker was taken prior to use. A waste beaker was placed under the column, and the stopcock was opened. The column was allowed to drip until an orange band formed and moved towards the bottom of the column. Once this orange band reached the bottom of the column, beaker #1 was placed under the column and collected the separation until the orange band disappeared and a white band was seen in the column. At this point, the stopcock was closed. 10 ml of ethyl acetate were poured into the column to serve as the eluant for the second fraction of unknown. The stopcock was opened, and once the second colored band reached the bottom of the column, this fraction was collected in beaker #2 until the column ran white again. The silica gel column was then dried and cleaned. The liquids collected in beakers #1 and #2 were dried and then the mass of each beaker with crystals formed inside was taken to calculate the yield of each compound. There was approximately 75 mg of each unknown in the original mixture. Melting point and TLC analysis of each separated solid was performed as well. For TLC analysis, a small crystal of each unknown was dissolved in .5 ml ethyl acetate and then separated with an eluant consisting of 4ml hexane and 1ml ethyl acetate. Rf values of each plate were measured as well.
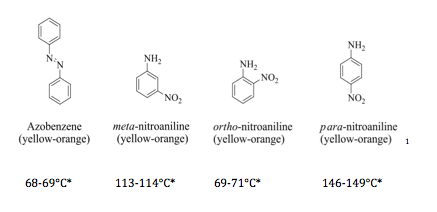
Possible unknowns for the column separation and their melting points are as follows:
Discussion of Results
Figure 1: TLC Rf Values
Rf,1 = Farthest traveled spot, Rf,1 = Shortest traveled spot
|
Mixture |
Rf,1 |
Rf,2 |
Rf,3 |
Rf,4 |
Notes |
| Pure hexane |
.33 |
.22 |
N/A |
N/A |
2 spots present |
| 5 ml hexane : .5 ml ethyl acetate |
.83 |
.61 |
.28 |
.11 |
4 spots present |
| 4 ml hexane : 1 ml ethyl acetate |
.9 |
.85 |
.6 |
.3 |
4 spots present |
| 3 ml hexane : 2 ml ethyl acetate |
.91 |
.77 |
.54 |
N/A |
3 spots present |
| Pure ethyl acetate |
.86 |
.81 |
.77 |
N/A |
3 spots present |
| Pure diethyl ether |
.95 |
.9 |
.8 |
N/A |
3 spots present |
| Pure dichloromethane |
.96 |
.9 |
.8 |
N/A |
3 spots present |
For our purposes, the best solvent mixture will have spotting of all four compounds present, as well as a wide range of Rf values. Choosing a correct eluant solvent is a fine line walked between choosing a solvent polar enough to carry the compounds up the TLC plate, while not being so polar that it does not allow the compounds to adhere to the TLC plate. In this case, hexane represents the nonpolar part of the solvent, while ethyl acetate represents the polar component. Adjusting the ratio of these two compounds on the eluant mixture allows the separation to be fine tuned for maximum efficiency. According to the data displayed in Figure 1, as the concentration of ethyl acetate increases in the eluant mixture, in general the measured Rf values increase. This indicates that the more polar solvent mixture is carrying the compounds further up the TLC plate, increasing the Rf value by making the distance the solvent travels and the distance the spots travel closer to each other. By the same logic, the higher the concentration of hexane in the eluant mixture, the lower the Rf values become as the more non-polar solvent pulls compounds a lesser distance up the TLC plate. Out of all tested solvent mixtures for elution, 5 ml hexane : .5 ml ethyl acetate and 4 ml hexane : 1 ml ethyl acetate both led to the development of 4 spots on the TLC plate, one of the criterion for an acceptable TLC solvent mixture. Additionally, the 5 ml hexane : .5 ml ethyl acetate mixture had the widest range of Rf values, indicating it to be the best choice of eluant.
In order to evaluate the identity of each spot on the TLC plate, we must examine the polarities of each compound in our mixture. On a TLC plate, the spot with the smallest Rf value is the most polar, as it is attracted most strongly to the silica plate and travels the shortest distance because of this. Following this logic, for the 5 ml hexane : .5 ml ethyl acetate mixture:
Rf,4: para-nitroaniline
Rf,3: ortho-nitroaniline
Rf,2: Benzophenone
Rf,1: Azobenzene
(in decreasing Polarity)
Figure 2: Column Chromatography
|
Unknown |
% Yield |
MP |
TLC Rf Value |
Notes |
Identity |
|
#1 |
51mg/75mg = 68% |
67-69°C |
.90 |
None | Azobenzene |
|
#2 |
46mg/75mg = 61.3% |
146-146°C |
.81 |
Some slight TLC spotting around Rf Value = .90 | Para-nitroaniline |
Several types of analysis were applied to the samples separated from the column chromatography. Firstly, the yield of each sample was taken based on the knowledge that each compound was present in the original mixture with a mass of 75mg. This give a yield for unknown #1 of 68% and a yield of unknown #2 of 61.3%. Next, melting points of each unknown were taken. The melting point of unknown #1 was 67-69°C and the melting point of unknown #2 was 146-146°C. In order to determine the purity of each sample, TLC analysis of each sample was performed. Unknown #1’s developed TLC plate showed one spot with an Rf value of .9 and unknown #2 showed one spot with an Rf value of .81 with slight spotting at an Rf value of .9. This indicates that there was some contamination of unknown #1 in the collected fraction of unknown #2. Unknown #1’s melting point indicated its identity to be Azobenzene, while unknown #2’s melting point indicated its identity to be para-nitroaniline.
Calculations and Figures
Column unknown #1 yield: 51mg/75mg = 68%
Column unknown #2 yield: 46mg/75mg = 61.3%
MP for unknown #1: 67-69°C
MP for unknown #2: 146-146°C
*Melting points obtained from Reaxys
