VIBRATION-ROTATION SPECTROSCOPY OF HCl
VIBRATION-ROTATION SPECTROSCOPY OF HCl
By: John Ricely
Abstract
Using the Nicolet 6700 spectrometer, the spectrum for HCl was analyzed. There were two branches that were apparent in the result of the spectroscopy, the R branch and the P branch, that correspond to ∆J= +1 and ∆J= -1, respectively. Each peak, differentiating between 35Cl and 37Cl, is assigned an m value and then plotted with wavenumber vs. m value. Analytical software is used to derive an equation of the line from the two plots of 35Cl and 37Cl. Constants were then derived for each of the isomers. The values for H35Cl are v0=2883.3 αe=-0.29 Be=9.98 De=-4.23E-4, with percent errors compared against literature values of 0.09%, 4.13%, 5.73% and 20.24%, respectively. The values for H37Cl are v0=2885.5 αe=-0.30 Be=9.95 De=-3.28E-4, with percent errors compared against literature values of 0.056%, 0.43%, 5.85% and 38.14%, respectively
Introduction
The purpose of this lab is to experimentally determine constants by analyzing the vibration-rotation quantized energy levels of the hydrochloric acid (HCl). Through an understanding of quantum mechanics, information about the nature of a chemical can be deduced. An important concept in quantum mechanics is the idea of quantized energy levels and accordingly the quantum numbers associated with them. Particles being described by wave mechanics are restricted to quantized energy levels.
Molecules can be described by vibrational and rotational states. These rotational states also exhibit quantum numbers, which are integers represented by the variable J. The simplest model of a rotating molecule is the rigid rotor. This method of describing a rotating molecule consists of two particles connected by a rigid bond. One condition of the rigid rotor is that the wave function must be identical when it rotated one full revolution. The vibrational states also exhibit a quantized characteristic. The vibrational quantum number is represented as v.
“…the set of selection rules for the pure rotational energy transitions observed in the far infrared or microwave spectrum of a linear molecule. The gross selection rule for such transitions states that the molecule will exhibit a pure rotational absorption spectrum only if the molecule possesses a permanent dipole moment” [1].
Vibrational spectroscopy only works if the molecule being observed has dipole moments. In other words, the electron distribution about the bond in the molecule must not be uniform. This therefore excludes molecules such as H2, N2 and O2 [2].
The spectrum of HCl shows two separate peaks, one for the each of the two isomers of chlorine. There are two branches in the spectrum observed in this lab report: the R branch, which corresponds to ∆J= +1, and the P branch, which corresponds to ∆J= -1. Each set of peaks in the branches are defined by m values, of which the R branch values are negative and the P branch values are positive.
Experimental
The Nicolet 6700 was used in this experiment to record the spectra, and Omnic software was used to record the data. Fisher Scientific provided the HCl used in this experiment, with lot number 100523.
First, the chamber in the Nicolet 6700 was purged with N2 gas. Next, one drop of HCl was put into the gas cell. The sample of the HCl was then collected in the gas phase. IGOR was used to analyze the data and to create the plots.
Results
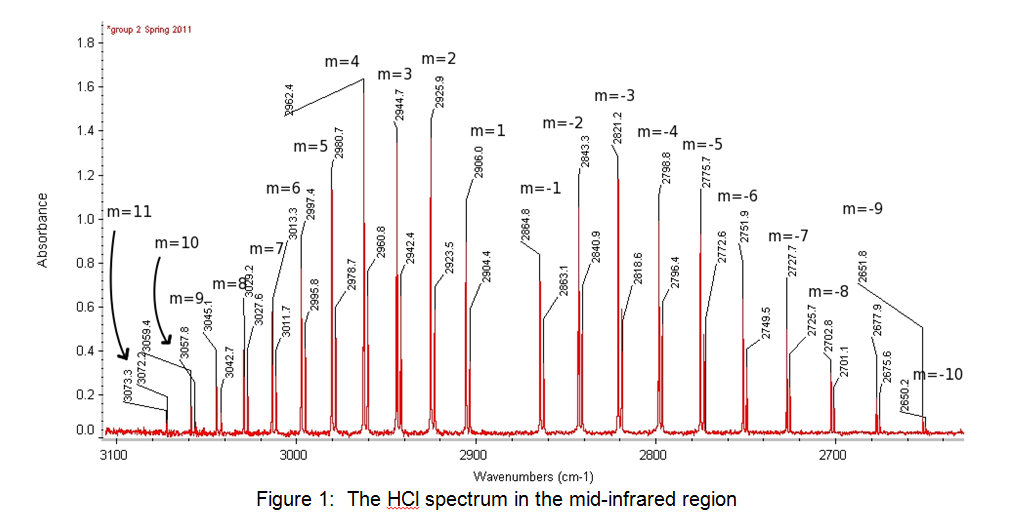
The peaks on the left of the spectrum shown in Figure 1 above are the R branch, and the peaks on the right are the P branch. Table 1 below shows the peaks and their values:
|
Peak (m) |
H35Cl wavenumber |
H37Cl wavenumber |
|
11 |
3073.3 |
3072.3 |
|
10 |
3059.4 |
3057.8 |
|
9 |
3045.1 |
3042.7 |
|
8 |
3029.2 |
3027.6 |
|
7 |
3013.3 |
3011.7 |
|
6 |
2997.4 |
2995.6 |
|
5 |
2980.7 |
2978.7 |
|
4 |
2962.4 |
2960.8 |
|
3 |
2944.7 |
2942.4 |
|
2 |
2925.7 |
2923.5 |
|
1 |
2906 |
2904.4 |
|
-1 |
2864.8 |
2863.1 |
|
-2 |
2843.3 |
2840.9 |
|
-3 |
2821.2 |
2818.6 |
|
-4 |
2798.8 |
2796.4 |
|
-5 |
2775.7 |
2772.6 |
|
-6 |
2751.9 |
2749.5 |
|
-7 |
2727.7 |
2725.7 |
|
-8 |
2702.6 |
2701.1 |
|
-9 |
2677.9 |
2675.6 |
|
-10 |
2651.8 |
2650.2 |
Table 1: Results from the spectroscopy
Discussion
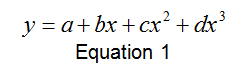
The raw data from Table 1 was plotted using the Igor software. The results are shown in Figure 2 and Figure 3:
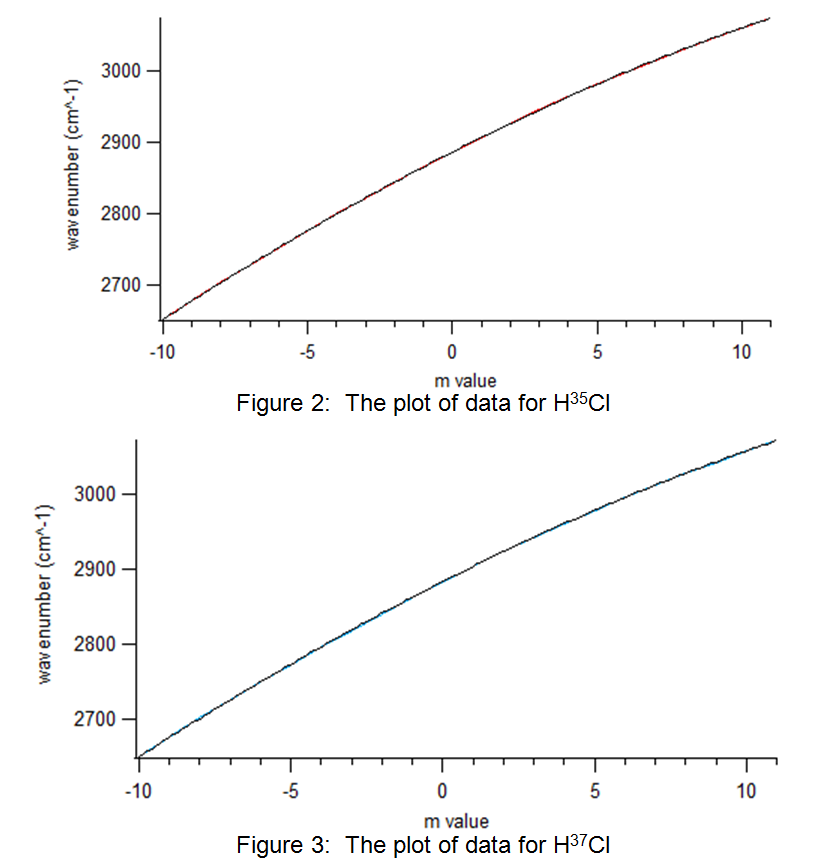
Figure 3: The plot of data for H37Cl
The plots above in Figure 2 and Figure 3 display a polynomial shape of the form:
|
H35Cl |
H37Cl |
|
| a | 2883.3 + 0.155 | 2885.5 + 0.12 |
| b | 20.559 + 0.0383 | 20.517 + 0.0296 |
| c | 0.29451 + 0.00289 | 0.30086 + 0.00223 |
| d | 0.0016925 + 0.000489 | 0.0013115 + 0.000378 |
Table 2: Coefficient values for H35Cl and H37Cl with error.
Where a=v0, b=-2(αe–Be ), c=-αe and d=-4De. From this equation, and using the values provided by the analytical software, these constants could be solved for. The values are solved for below in Table 3
| H35Cl | H37Cl | |
| v0 | 2883.3 + 0.155 | 2885.5 + 0.12 |
| αe | -0.29451 + 0.0383 | -0.30086 + 0.0296 |
| Be | 9.98499 + 0.00289 | 9.95764 + 0.00223 |
| De | -4.23125×10⁻⁴ + 0.00489 | -3.27875×10⁻⁴ |
Table 3: Values for the four constants in question.
Literature values for the constants above are shown in Table 4 below:
|
|
H35Cl | H37Cl |
| v0 | 2885.9 [3] | 2883.879 [3] |
| αe | 0.30718 [3] | .30216 [4] |
| Be | 10.5923 [3] | 10.5764 [3] |
| De | 5.305×10⁻⁴ [3] | 5.300×10⁻⁴ [3] |
Table 4: Literature values for the four constants in question.
The experimental values were compared against literature values, the percent errors are shown below in Table 5:
| H35Cl | H37Cl | |
| v0 | 0.09009% | 0.05621% |
| αe | 4.125% | .4302% |
| Be | 5.734% | 5.850% |
| De | 20.24% | 38.14% |
Table 5: Percent Errors for the constants.
As most of the data in this experiment was processed using computer software, the most likely source of error is from random human error. For example, improper preparation of the sample to be used in the experiment or misuse of the Nicolet 6700 could be potential causes of error.
Resources
[1] Moynihan, Cornelius . “Rationalization of the ΔJ=±1 Selection Rule for Rotational
Transitions.” California State College at Los Angeles. 46.7 (1969): 431. Print.
[2] University of South Carolina, Department of Chemistry and Biochemistry.
“Rotation-Vibration Spectroscopy of HCl (g)”. N.p.. Web. 4 Mar 2013.
[3] E.K. Plyler and E.D. Tidwell “The Rotational Constants of Hydrogen
Chloride” Zeitschrift für Elektrochemie 64 (1960), 717-20.
[4] A. Levy, I. Rossi, C. Joffrin and N. van Thanh “Spectre de Vibration-
Rotation de L’Acide Chlorhydrique Gazeux Etude de la Bande ν0->2 à 1.7 Micron” J. de Chimie Physique et de Physico-Chimie Biologique 62 (1965), 600-3.
