Determining the pKa of Bromothymol Blue by spectrophotometry
James Robertson
Chemistry 2220
Determining the pKa of Bromothymol Blue by spectrophotometry
Abstract
To determine the pKa of an acid-base indicator, specifically bromothymol blue, different amounts of both 0.1M NaOH and 0.1 M HCl were added to a solution of fixed concentration of bromothymol blue and the pH was monitored via pH meter. At different pH readings around the researched pKa of Bromothymol blue we measured absorbance of the buffer solution. By superimposing the absorbance graphs, two wavelengths of absorbance were observed as well as an isosbestic point. These wavelength values did not deviate much from the values in the literature and although the calculated pKa varied slightly with the value from the online literature, the value in the literature is an approximation.
Experimental Procedure
Indicators are acids or bases whose various protonated forms have different colors. Indicators work as buffers, which is why most have a transition range of ~1 pH over which one can view either one color ( if the pH of the solution measured is outside of the transition range) or a combination of two colors (if the pH of the solution measured is within the transition range).
For this experiment, we chose bromothymol blue, an indicator with a pKa value of ~7.1 and a transitional range of 6.0 to 7.6 pH units. First we added 1 mL of 0.1 M HCl to 15 mL of water. To this solution we added 2 drops of bromothymol blue and measured the pH and the absorbance. We repeated this process exactly, replacing the 0.1 M HCl with 0.1 M NaOH and measured the pH and absorbance. These measurements from the diluted HCl and NaOH solutions provide us with an absorbance that is almost 100% HIn and another that is almost 100% In-, respectively. These acted as reference absorbance values.
Then 12.5 drops of bromothymol blue were added to 100 mL of water to keep the concentration of bromothymol blue constant. It is important to keep the total concentration of bromothymol blue constant so that [In-]+[HIn] always equals the same total concentration. If the total concentration of bromothymol blue were not fixed, the reference absorbance values will not work in calculation and the ratio [In-]/[HIn] will not be calculated properly for all trials. Next, 0.1 M HCl was added drop-wise in rotation with 0.1 M NaOH until the solution had a pH of 6.2. Once a pH of 6.2 was reached and remained fairly constant, the absorbance was measured. We measured the absorbance at this pH because it was within the transitional range of bromothymol blue. We repeated the procedure above to attain a solution with a pH of 7.5 and then measured the absorbance. This process was repeated twice more to gain two absorbance spectra, one of pH 5.5 and another of pH 8.1. These absorbance spectra all showed two peaks at the same wavelengths with differing absorbance values due to the different ratios of [In-]/[HIn] of each solution.
Results
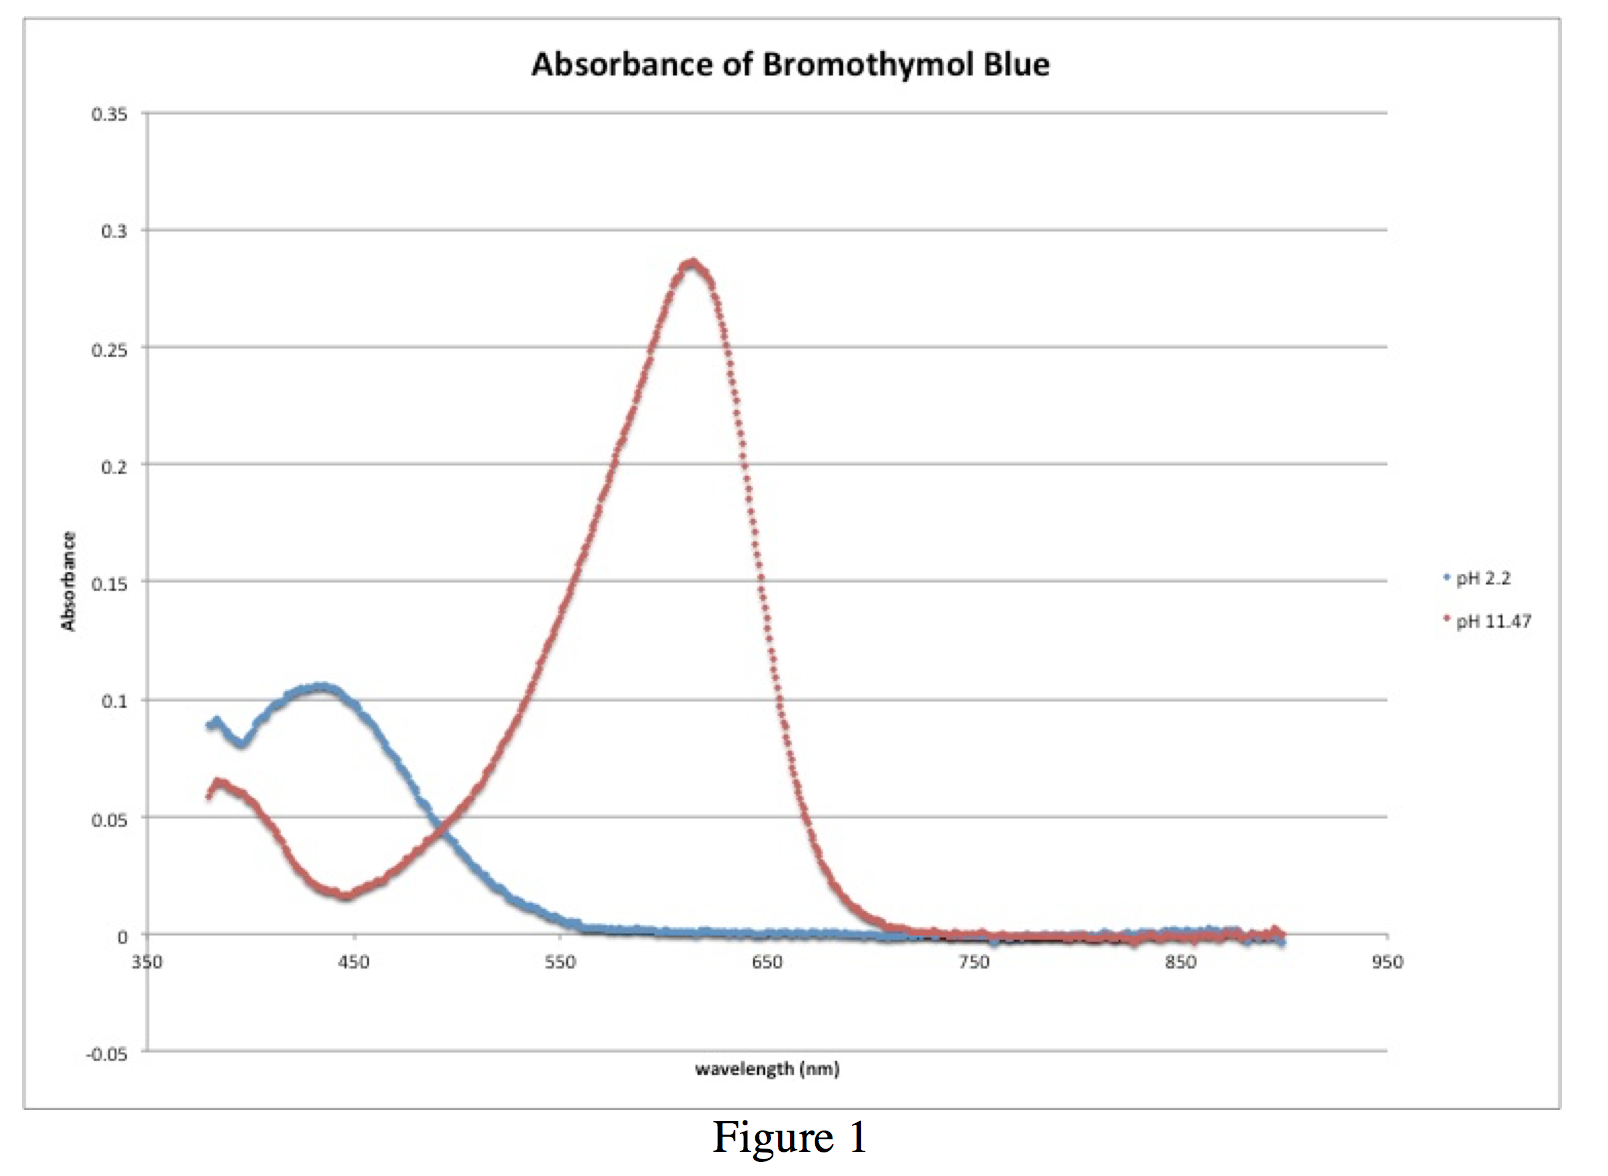
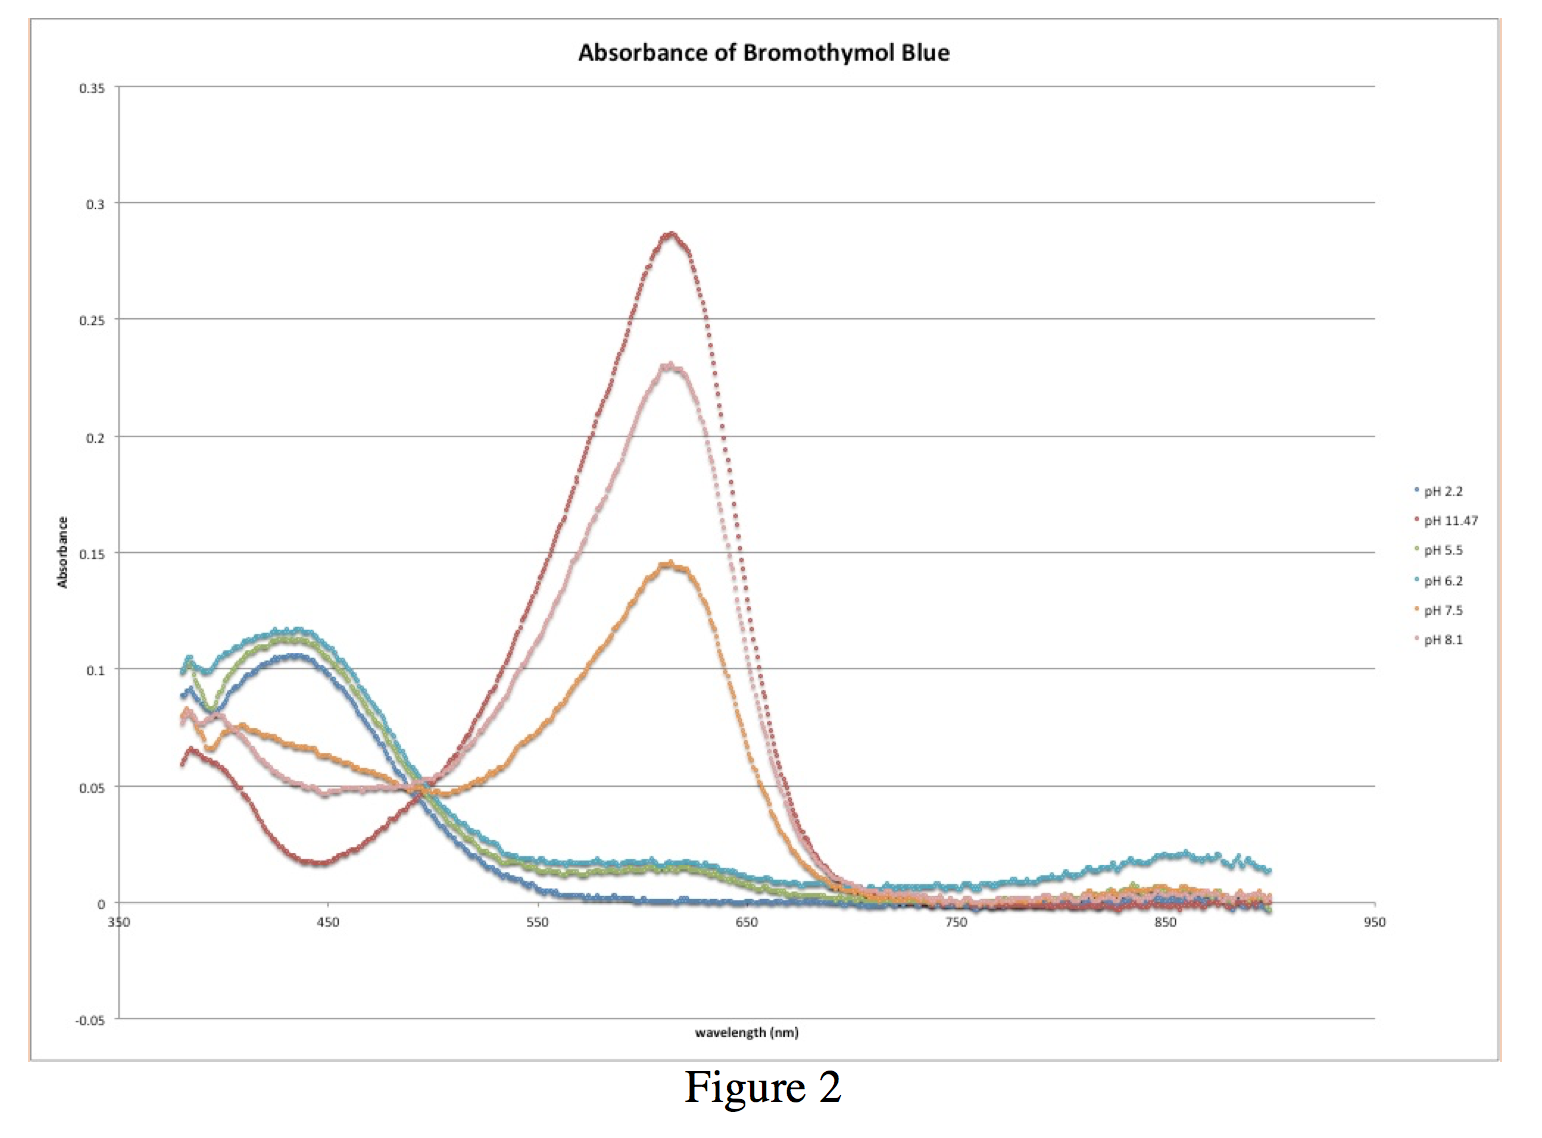
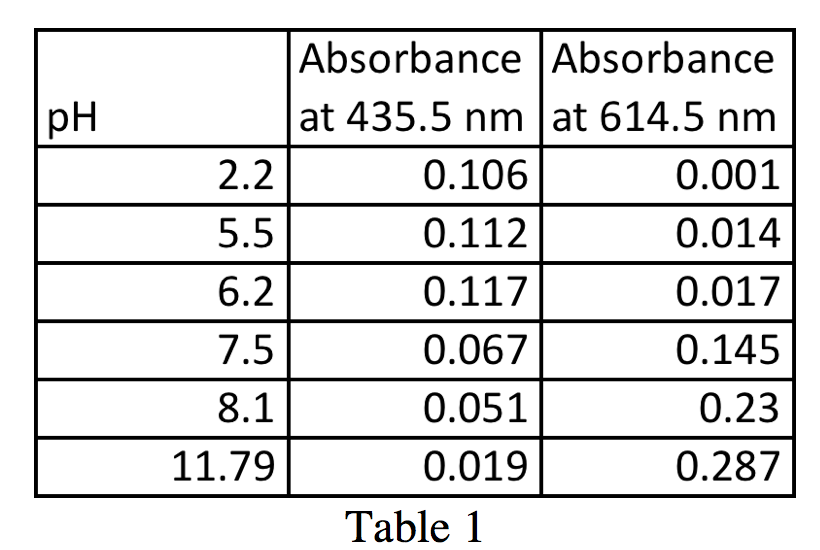
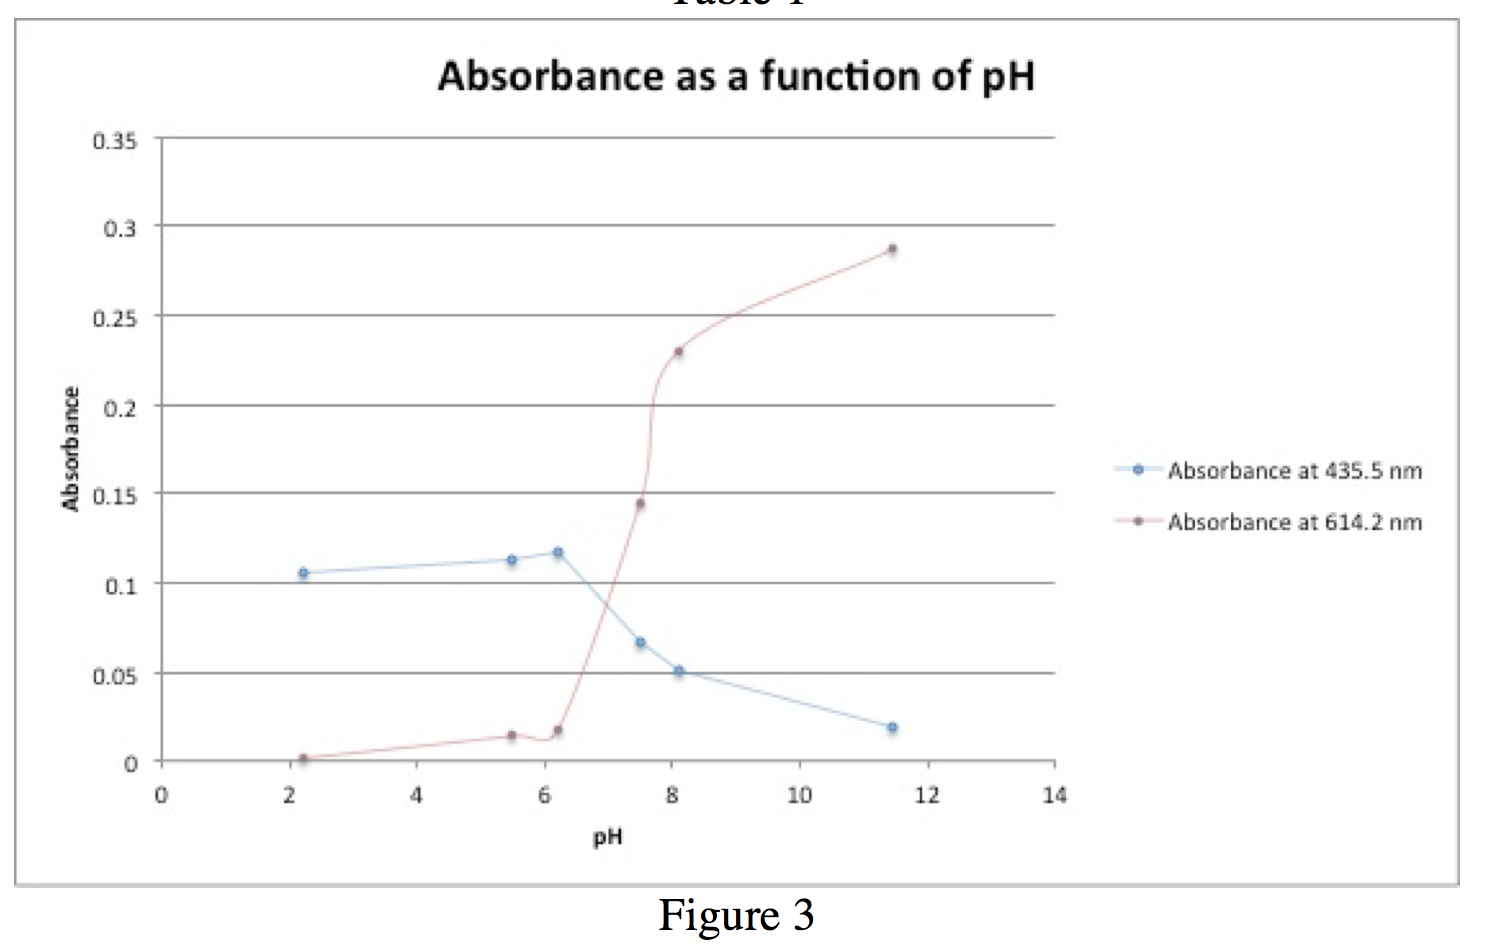
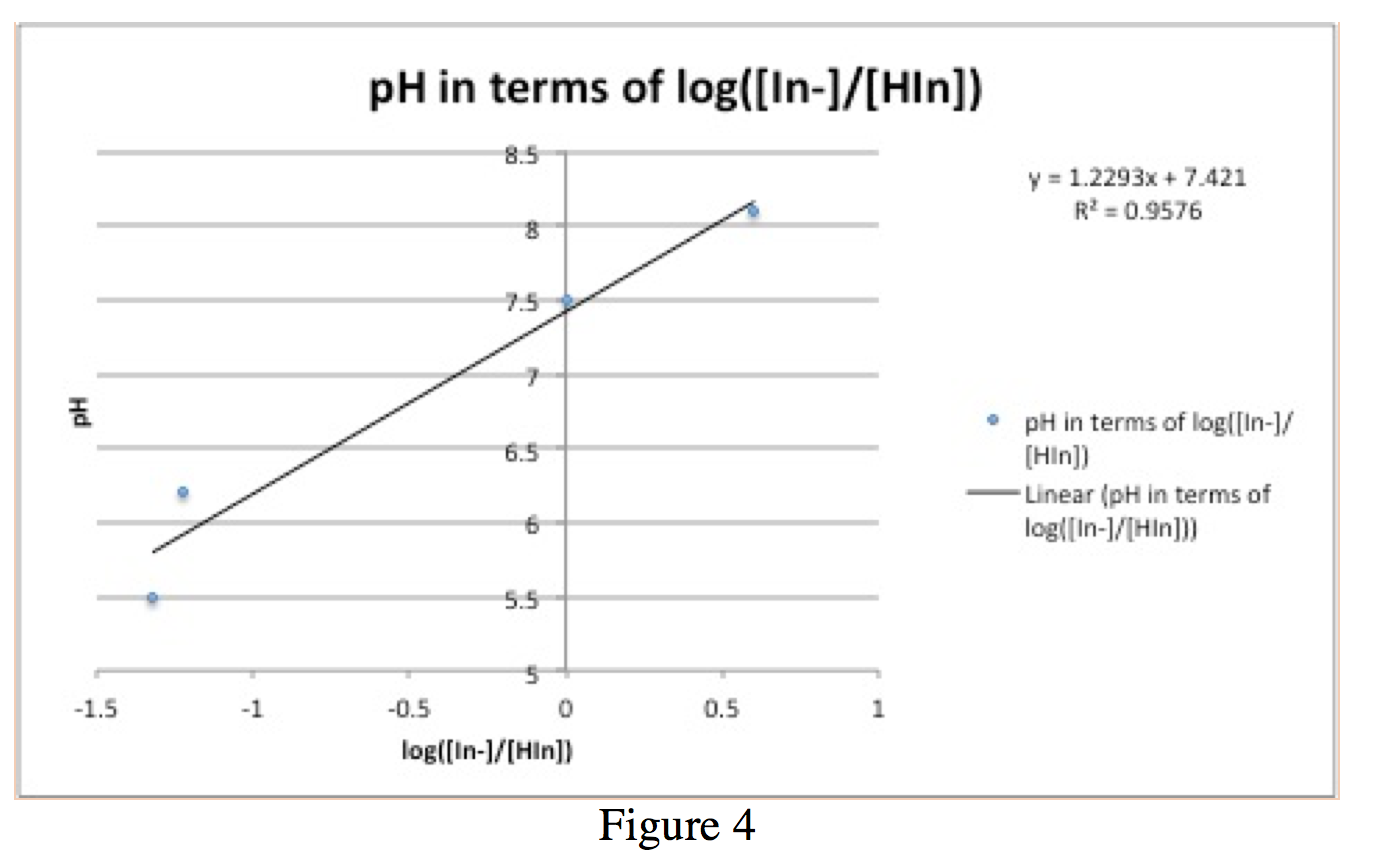
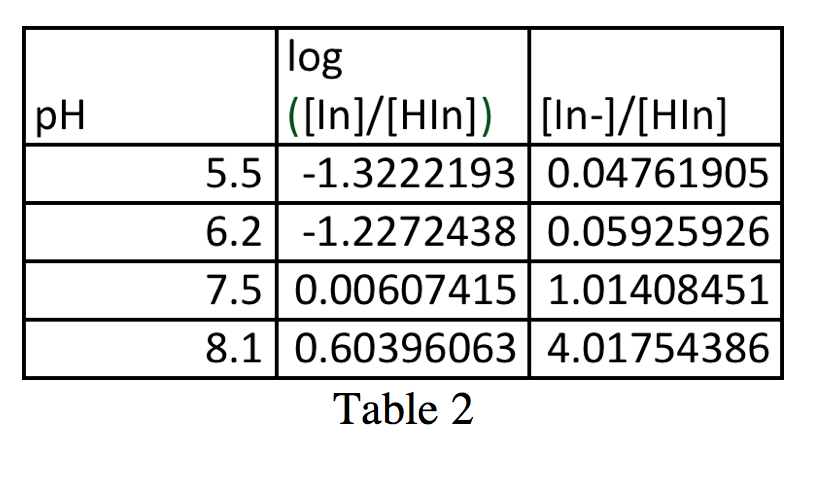
Figure 1 shows the absorbance spectra of the reference solutions, the blue spectrum from the solution with pH 2.2 and the red spectrum from the solution with pH 11.47. These provide the wavelengths at which bromothymol blue has peaks, one at 435.5 nm from the solution of ~100% HIn, and another at 614.5 nm from the solution of ~100% In–. The two absorbance values from these graphs, 0.106 at 435.5 nm and 0.287 at 614.5 nm, along with the other absorbance values from the intermediate pH trials are used to calculate the ratio [In–]/[HIn]. It is also important to note the isobestic point that occurs approximately at 496.9 nm with an absorbance of 0.049.
From Figure 2, a graph of all of the absorbance spectra superimposed on each other, as well as Table 1, it is possible to calculate the ratio [In–]/[HIn]. With these values, we can plot a graph of pH vs. log([In–]/[HIn]) (figure 4). For simplicity in calculations, I will call the max absorbance at 614.5 nm AIn and the minimum absorbance at 614.5 AHIn.
These values appear in Table 2.
Figure 3 is a graph of absorbance vs. pH. The blue line indicates absorbance at 435.5 nm, which corresponds to absorbance activity of HIn. The red line indicates absorbance at 614.5 nm, which corresponds to absorbance activity of In–. When ([In–]/[HIn])=1, pH=pKa because pH=pKa+log([In–]/[HIn]). This occurs when [In–]=[HIn].
In this case, the estimated pKa value is ~7.5.
Figure 4 is a graph of the Henderson-Hasselbalch equation, pH=pKa+log([In–]/[HIn]). By graphing pH vs. log(([In–]/[HIn]) (values in table 2), one gains a line with slope approximately of 1 and a y-intercept of the pKa value. The pKa value in this case is 7.421, which deviates from the pKa value of ~7.5 calculated before.
[1] http://www.sigmaaldrich.com/catalog/product/sial/114413?lang=en®ion=US
[1]http://ehsrms.uaa.alaska.edu/CMS/Laboratory/ChemList/Acid%20Base%20Indicators.pdf
