
Review of Basic Techniques and Purifying Proteins
Written by Kasia Bender
About this lab: Before purifying a protein, a lab has to be able to make solutions of known concentration and deliver small volumes accurately. This review exercise covers both skills: calculating solution concentrations (molarity and percent mass/volume), diluting stocks into a working mix, and checking pipet accuracy by weighing delivered water. The tables below record the student data for each part.
Objectives:
– To practice calculating various solution components, including molarity and % (m/v).
– To practice the use of a graduated pipet and micropipette.
– To review lab safety.
Purifying Proteins
Part I A: Calculations
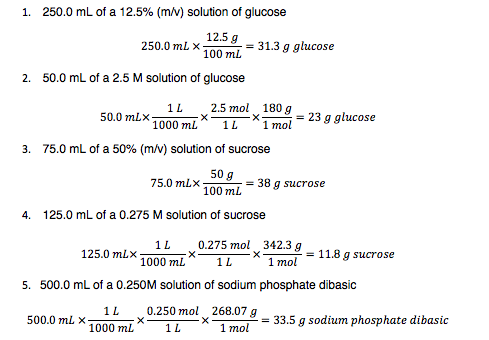
Molarity is moles of solute per liter of solution: M = mol solute / L solution. Worked example: to make 250 mL of 0.500 M NaCl (molar mass 58.44 g/mol), you need 0.500 mol/L × 0.250 L = 0.125 mol, and 0.125 mol × 58.44 g/mol = 7.31 g of NaCl, dissolved and brought to a final volume of 250 mL.
Percent mass/volume, % (m/v), is grams of solute per 100 mL of solution. Worked example: physiological saline is 0.9% (m/v), meaning 0.9 g of NaCl per 100 mL; 500 mL of it therefore contains 0.9 g × 5 = 4.5 g of NaCl.
Dilutions use C1V1 = C2V2. The master mix in Table 2 below follows this: its components add up to 440 µL (55 + 44 + 2.66 + 2.66 + 335.68), so 55 µL of 10x buffer gives 10x × 55/440 = 1.25x, and 44 µL of 2.5 mM dNTPs gives 2.5 mM × 44/440 = 0.25 mM. Diluting the mix to 1x buffer (a 0.8 factor) gives the assay values of 0.20 mM dNTPs and 0.30 µM of each primer.
Sources: OpenStax Chemistry 2e, 3.3 Molarity and 3.4 Other Units for Solution Concentrations. For a standardization example, see Preparing Standard Acid and Base – Finding Molarity.
Part I B: Preparing Solutions
Table 1: Standard dilution series (concentration, stock volume and buffer volume for each sample)
|
Sample |
Conc. (µg/µL) |
glucose (µL) |
buffer (µL) |
|
1 |
0.0 |
0.0 |
187.5 |
|
2 |
1.0 |
30.0 |
187.5 |
|
3 |
2.0 |
60.0 |
187.5 |
|
4 |
3.0 |
90.0 |
187.5 |
|
5 |
4.0 |
120.0 |
187.5 |
|
6 |
5.0 |
150.0 |
187.5 |
Table 2: Master mix and final assay concentrations (stock concentration, volume added to the master mix, concentration in the master mix, and concentration in the assay)
|
Stock |
MM vol. |
MM conc. |
Assay |
|
|
Buffer |
10 x |
55 µL |
1.25 x |
1 x |
|
DNTPs |
2.5 mM |
44 µL |
0.25 mM |
0.20 mM |
|
Primer 1 |
62.0 µM |
2.66 µL |
0.375 µM |
0.30µM |
|
Primer 2 |
62.0 µM |
2.66 µL |
0.375 µM |
0.30 µM |
|
Water |
— |
335.68 µL |
— |
— |
Part I C: Pipet Accuracy
Table 3: Graduated pipet, mass of water delivered (weighed in a microcentrifuge tube)
|
Student 1 |
Student 2 |
|
| Mass of microcentrifuge tube alone |
1.05 g |
1.02 g |
| Mass of microcentrifuge tube & water |
2.05 g |
2.03 g |
| Mass of water |
1.00 g |
1.01 g |
Table 4: Micropipette, mass of water delivered (weighed in a microcentrifuge tube)
|
Student 1 |
Student 2 |
|
| Mass of microcentrifuge tube alone |
1.08 g |
1.07 g |
| Mass of microcentrifuge tube & water |
1.18 g |
1.17 g |
| Mass of water |
0.10 g |
0.10 |